Open Access
Fig. C.1.
Download original image
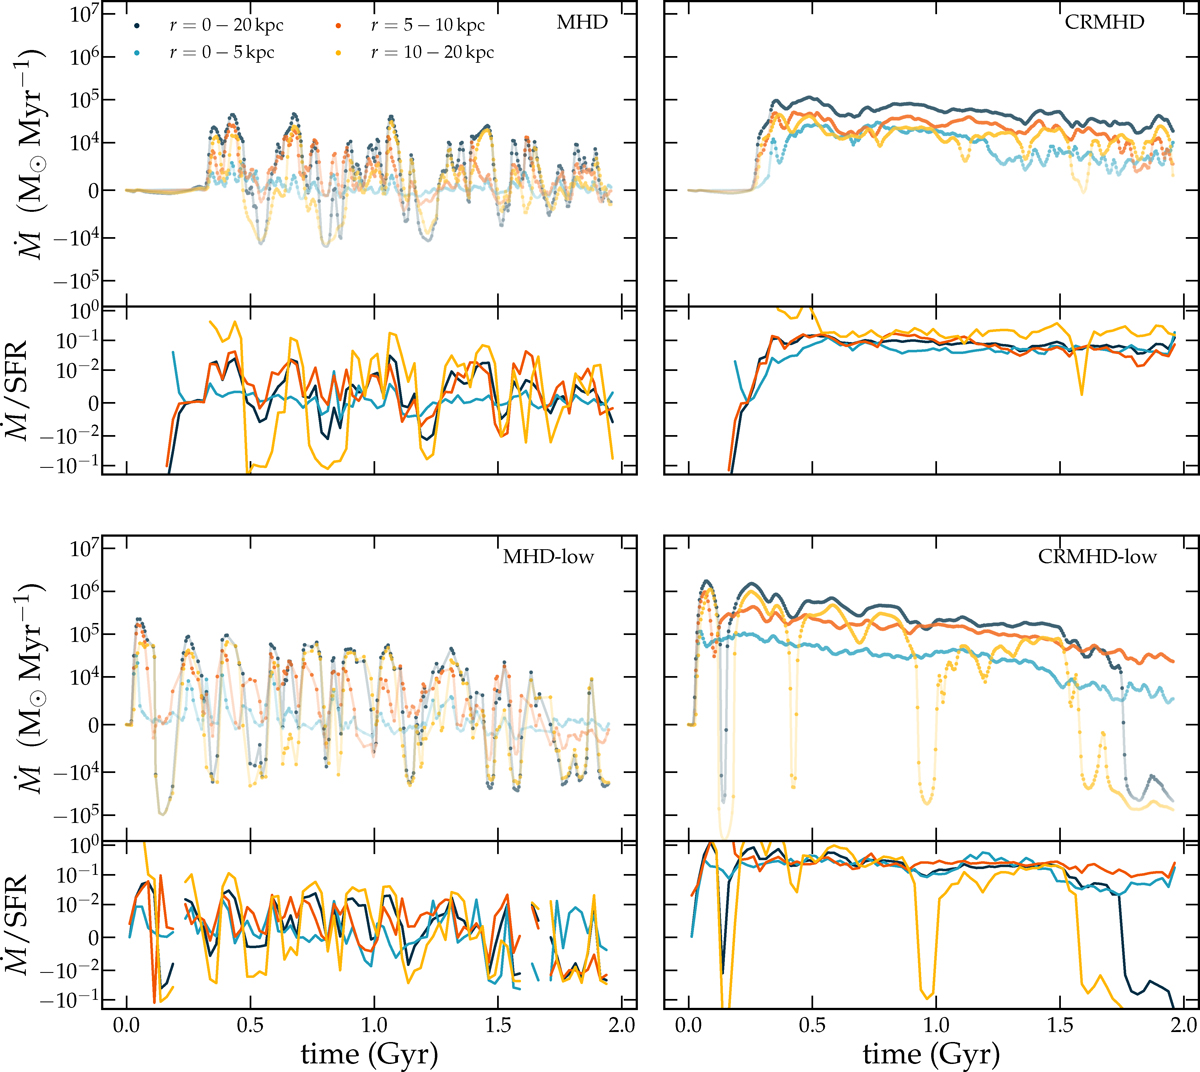
Mass outflows at |z| = 10 kpc for our four simulated galaxies. The upper panels show the mass outflow rate as a function of time, with different colors signifying different radial bins. The lower panels show the mass outflow rate scaled by the SFR, also known as the mass-loading factor.
Current usage metrics show cumulative count of Article Views (full-text article views including HTML views, PDF and ePub downloads, according to the available data) and Abstracts Views on Vision4Press platform.
Data correspond to usage on the plateform after 2015. The current usage metrics is available 48-96 hours after online publication and is updated daily on week days.
Initial download of the metrics may take a while.