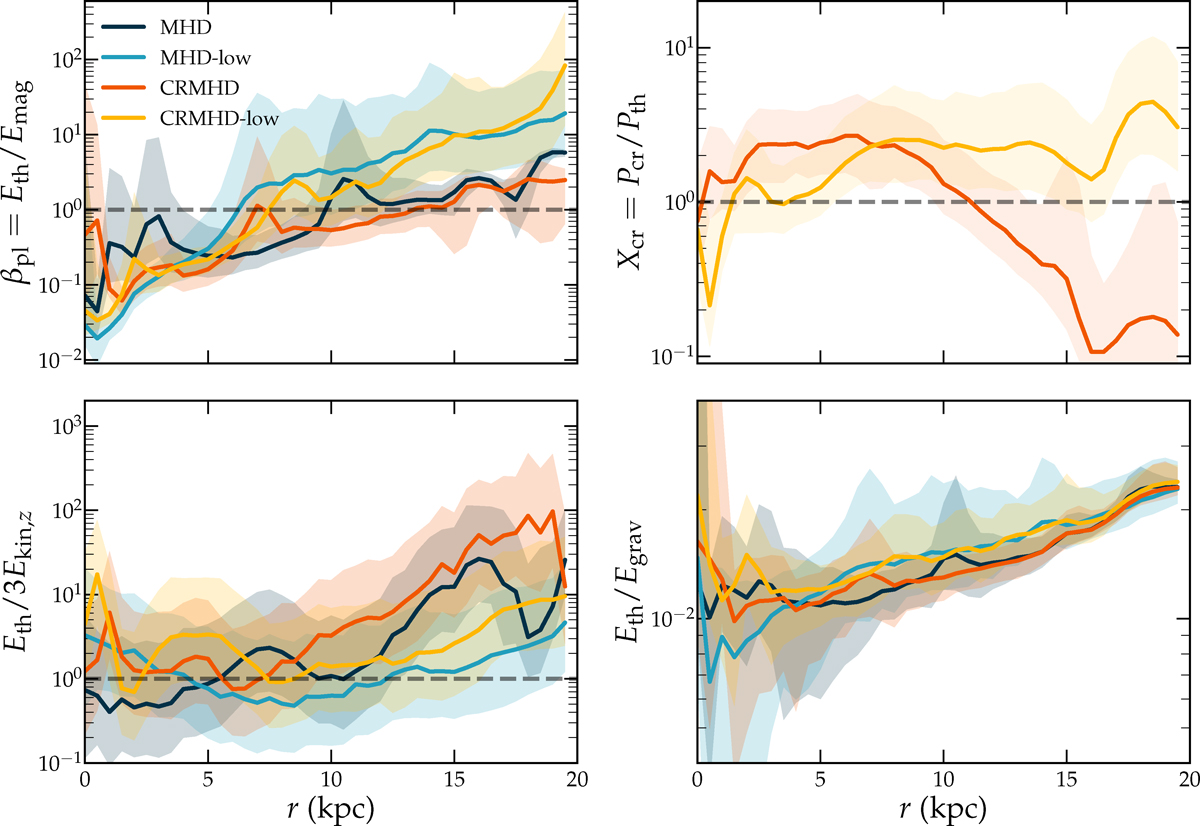
Fig. 7.
Download original image
Radial profiles of the energy ratios from Figure 6 in the galactic disk. The median values of the given energy ratio for each radial bin are plotted, considering cells within a height of 1 kpc and looking at our fiducial time t = 1.5 Gyr. Shaded regions denote the 25th and 75th percentile. The dashed lines denote where the energy components are equal; i.e., where we have equipartition.
Current usage metrics show cumulative count of Article Views (full-text article views including HTML views, PDF and ePub downloads, according to the available data) and Abstracts Views on Vision4Press platform.
Data correspond to usage on the plateform after 2015. The current usage metrics is available 48-96 hours after online publication and is updated daily on week days.
Initial download of the metrics may take a while.