Fig. 1
Download original image
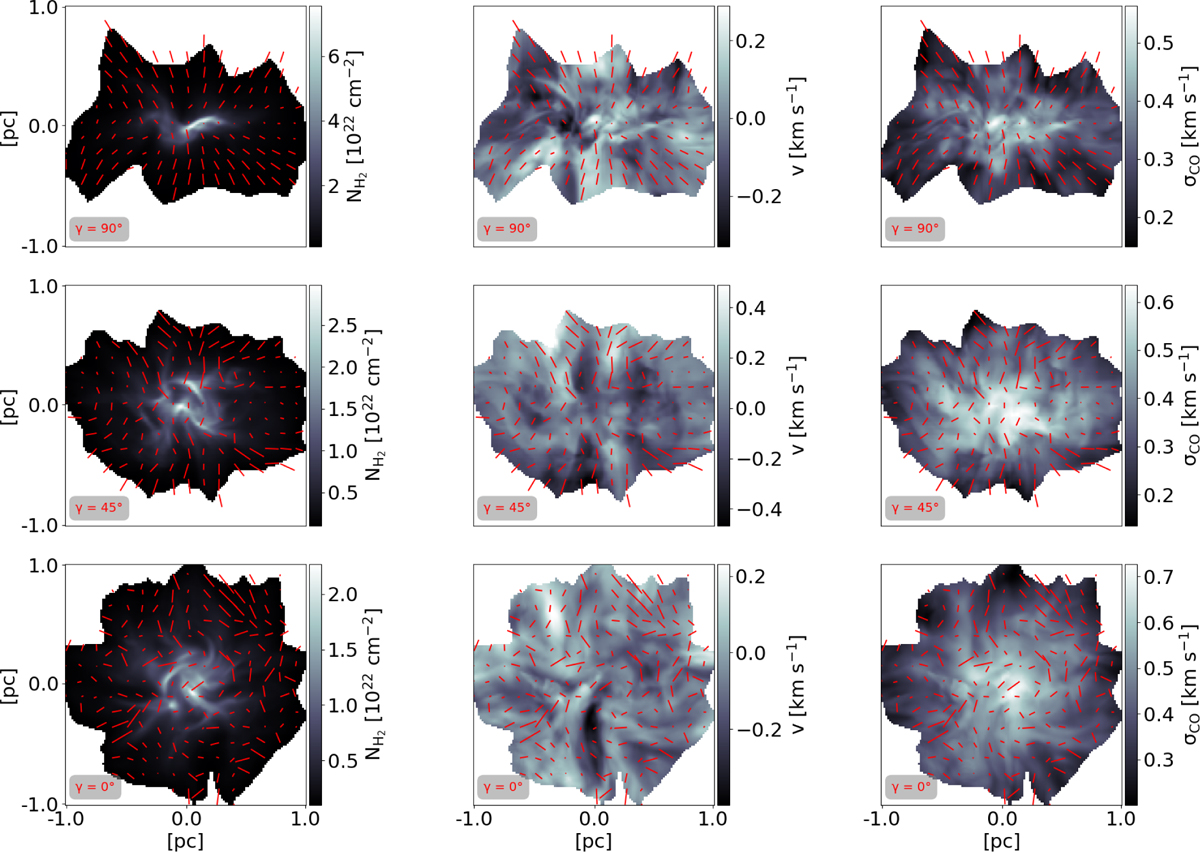
Column density (left column), first moment (middle column), and second moment maps (right column) for three inclination angles (γ). The red lines correspond to the polarization pseudo-vectors. To generate the moment maps, we used the CO J = 1 → 0 line. The modeled cloud was analyzed at a time corresponding to 1.2 times the free fall time, at which stage the central number density has reached a value of 105 cm−3.
Current usage metrics show cumulative count of Article Views (full-text article views including HTML views, PDF and ePub downloads, according to the available data) and Abstracts Views on Vision4Press platform.
Data correspond to usage on the plateform after 2015. The current usage metrics is available 48-96 hours after online publication and is updated daily on week days.
Initial download of the metrics may take a while.