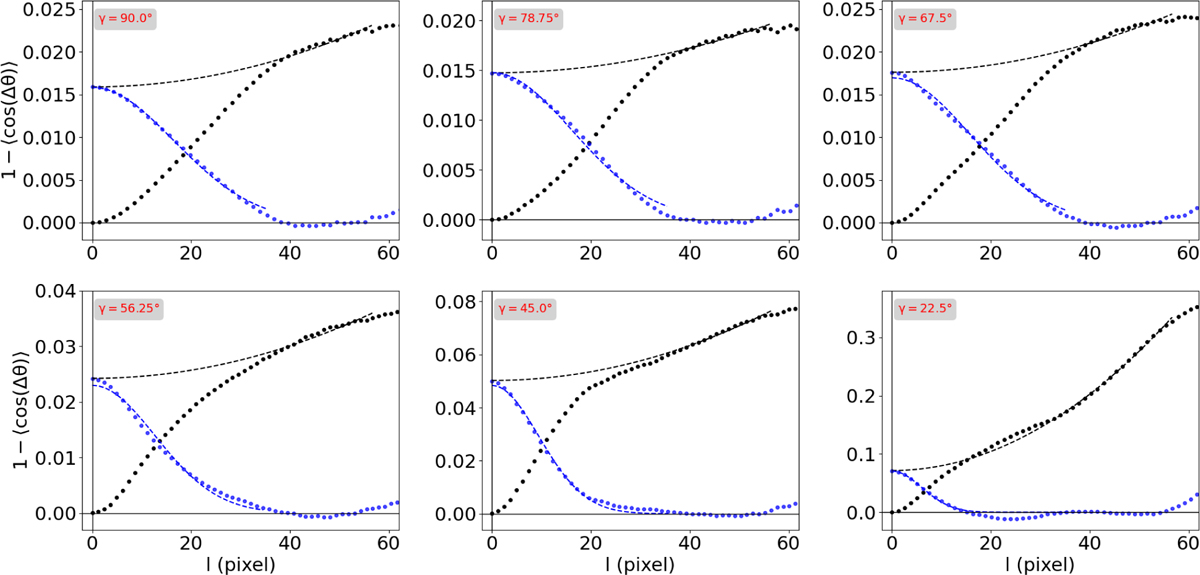
Fig. B.1
Download original image
Dispersion functions for various inclination angles. In each panel, the black dots correspond to the dispersion function computed using Eq. B.1 on every panel. Different panels refer to different inclination angles. The model fit at large scales is shown with the black dashed curve. Blue points mark the dispersion function with the black line subtracted, and the blue line shows the fit of Eq. B.2 (only the exponential term).
Current usage metrics show cumulative count of Article Views (full-text article views including HTML views, PDF and ePub downloads, according to the available data) and Abstracts Views on Vision4Press platform.
Data correspond to usage on the plateform after 2015. The current usage metrics is available 48-96 hours after online publication and is updated daily on week days.
Initial download of the metrics may take a while.