Fig. 6
Download original image
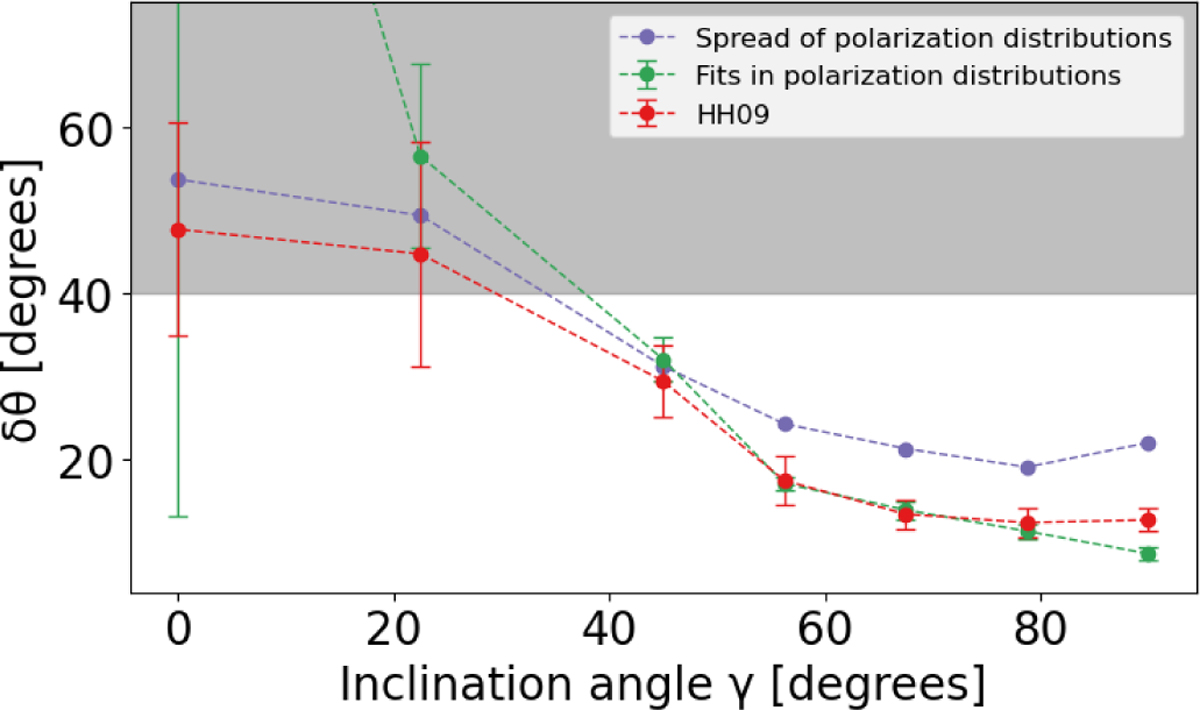
Polarization angle dispersion as a function of the inclination angle γ. The dashed purple line represents the values extracted using the circular standard deviation of the polarization distributions, the dashed green line using the Gaussian fits, and the dashed red line using the HH09 method. The green point at γ = 0° is off the scale at value δθ ≈ (150 ± 140)°. The gray shaded region corresponds to values of δθ that exceed 40°. The employment of the dispersion angle methods becomes questionable under such considerable spreads, because of the π ambiguity in δθ, which limits the dynamic range of the observable.
Current usage metrics show cumulative count of Article Views (full-text article views including HTML views, PDF and ePub downloads, according to the available data) and Abstracts Views on Vision4Press platform.
Data correspond to usage on the plateform after 2015. The current usage metrics is available 48-96 hours after online publication and is updated daily on week days.
Initial download of the metrics may take a while.