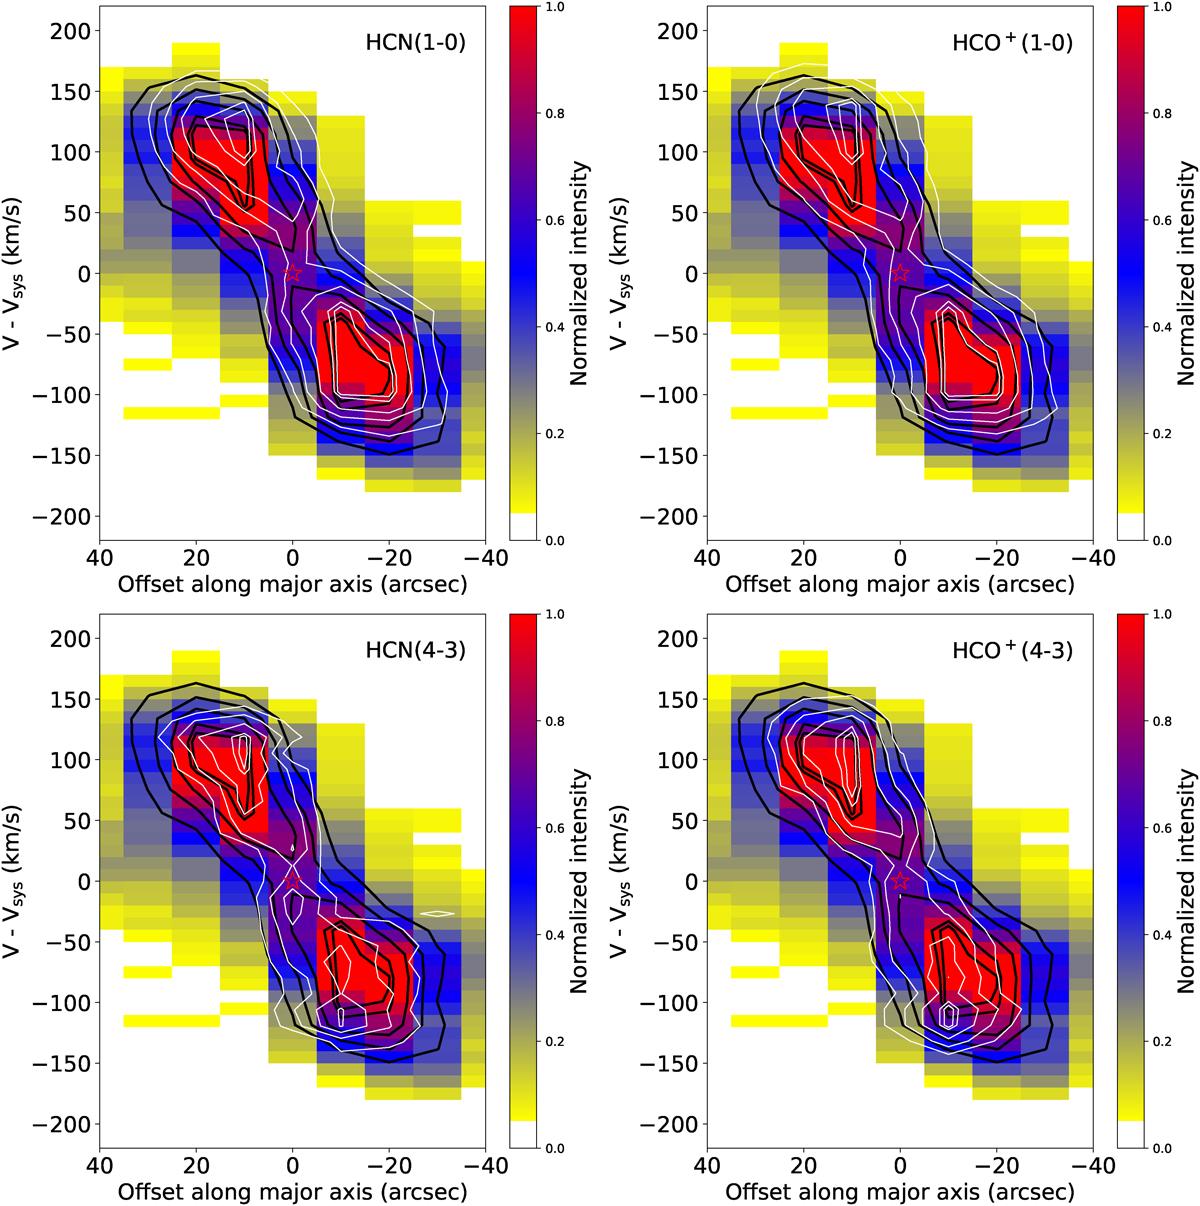
Fig. 3.
Download original image
Position-velocity diagrams along the major axis. Velocity 0 corresponds to the systemic velocity of the galaxy, Vsys(LSR) = +225 km s−1 (Neininger et al. 1998), and the position (0,0) is marked by a star. The contour levels are at 30%, 50%, 70%, 90%, and 95% of the peak intensities. The white contours represent HCN(1–0), HCO+(1–0), HCN(4–3), and HCO+(4–3), while the black contours correspond to the CO(3–2). Color scale shows the normalized intensity of CO(1–0).
Current usage metrics show cumulative count of Article Views (full-text article views including HTML views, PDF and ePub downloads, according to the available data) and Abstracts Views on Vision4Press platform.
Data correspond to usage on the plateform after 2015. The current usage metrics is available 48-96 hours after online publication and is updated daily on week days.
Initial download of the metrics may take a while.