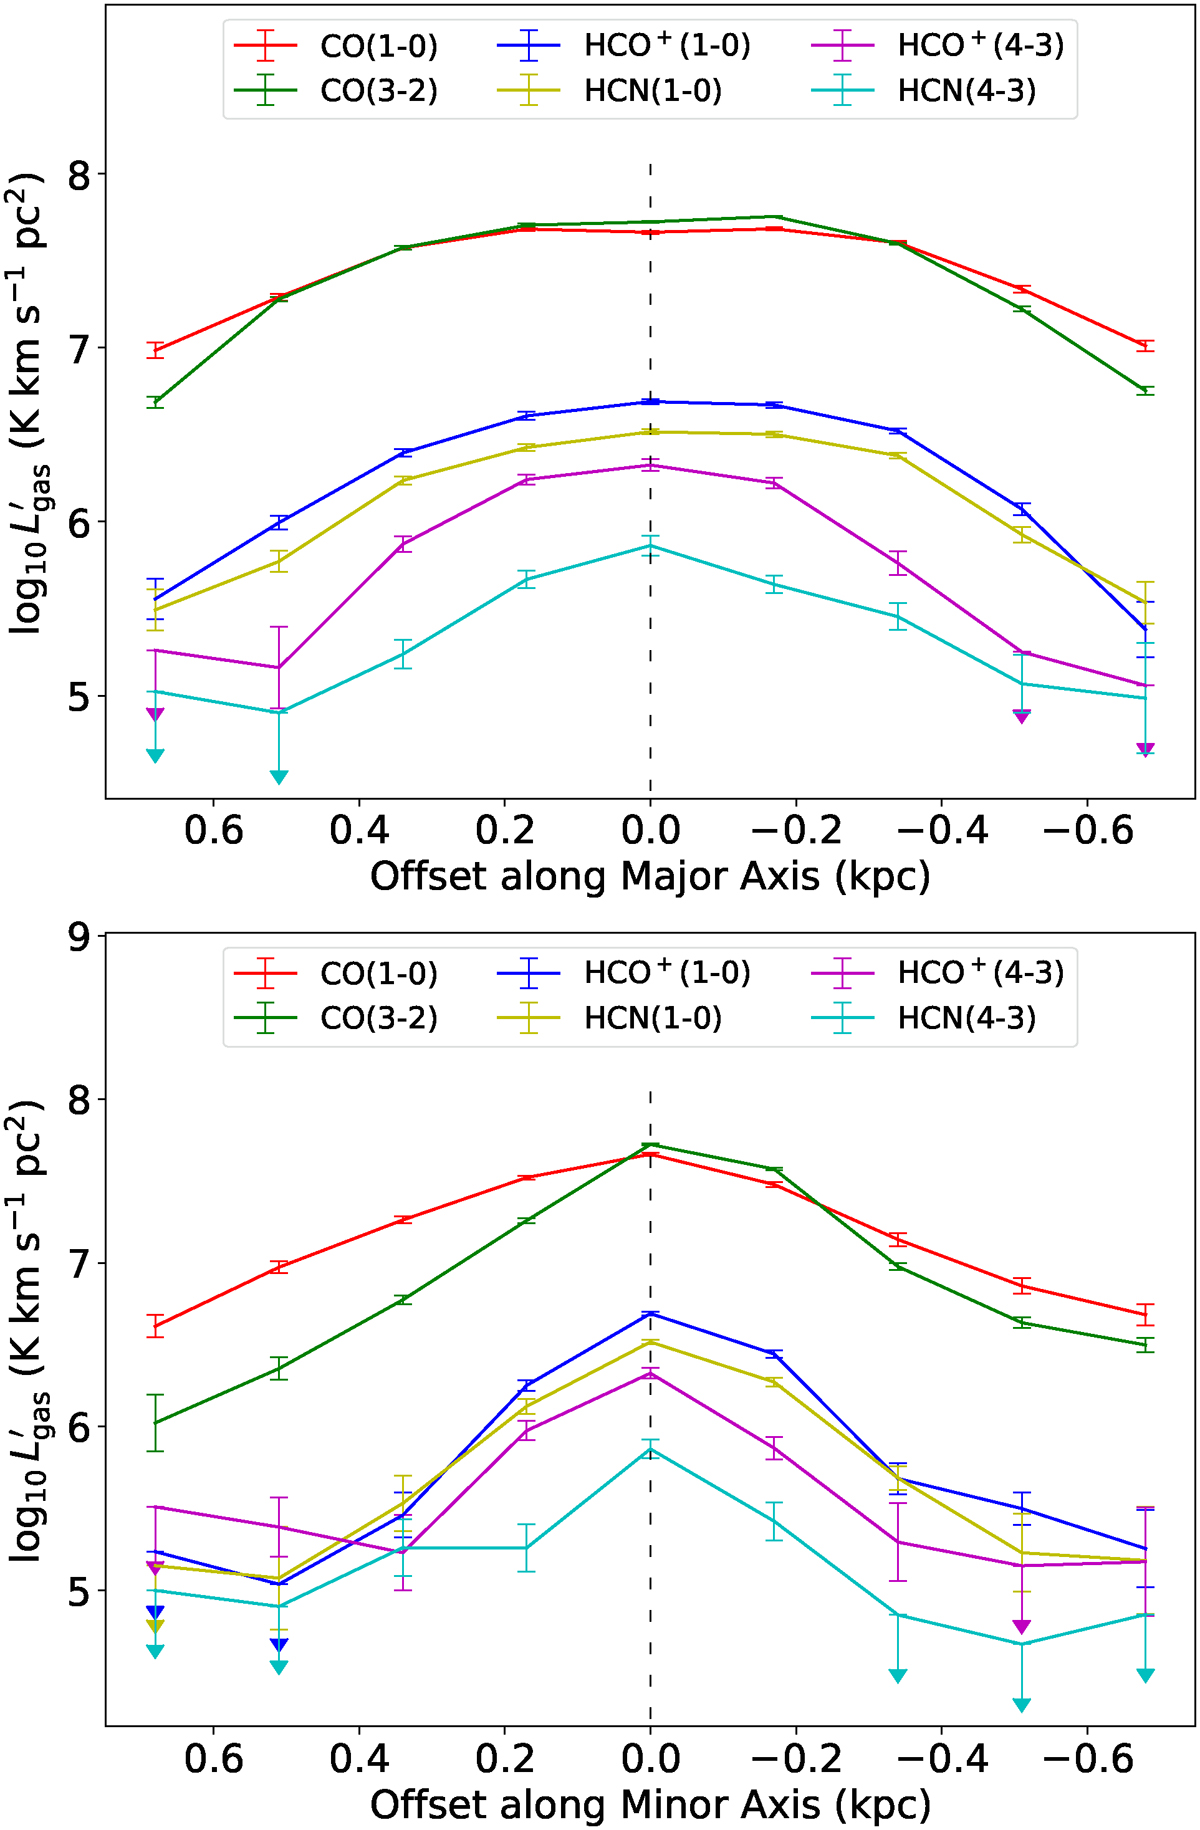
Fig. 5.
Download original image
Top: Distribution of the line luminosity of various molecular gas tracers along the major axis. A dashed line is drawn to mark offset = 0. Bottom: Similar to the upper figure, but along the minor axis. Given that the inclination angle of the outflow is quite small (∼10°, Leroy et al. 2015), we assume that 1″ along the minor axis associated with the outflow corresponds to a projected distance of about 17 pc, the same as along the major axis.
Current usage metrics show cumulative count of Article Views (full-text article views including HTML views, PDF and ePub downloads, according to the available data) and Abstracts Views on Vision4Press platform.
Data correspond to usage on the plateform after 2015. The current usage metrics is available 48-96 hours after online publication and is updated daily on week days.
Initial download of the metrics may take a while.