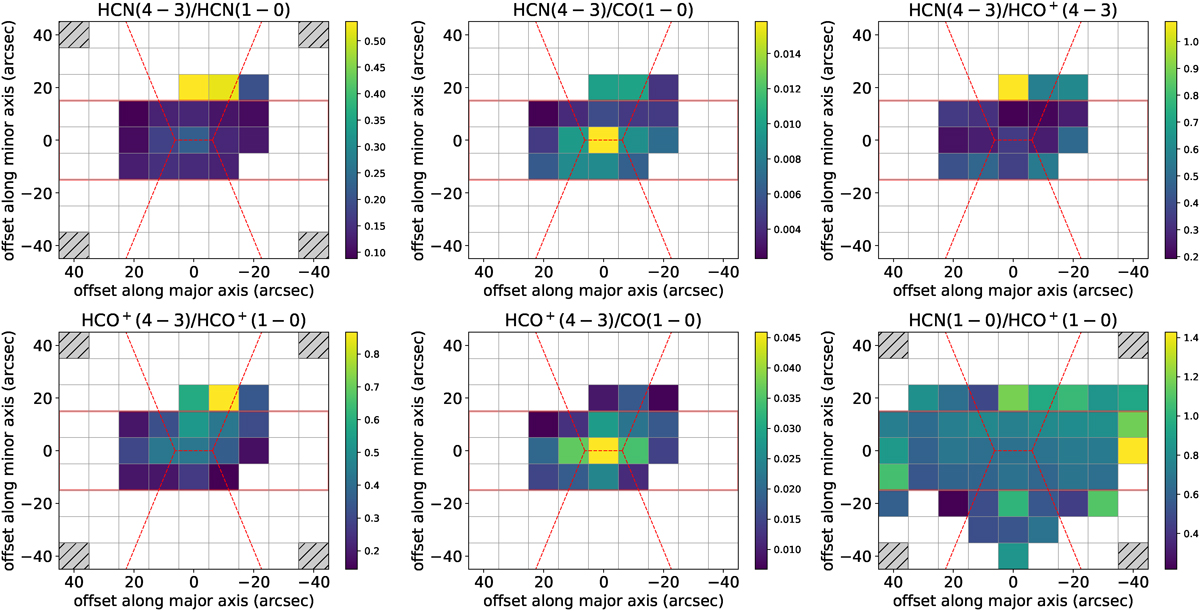
Fig. 7.
Download original image
Distribution of the luminosity ratios HCN (4–3)/(1–0), HCO+(4–3)/(1–0), HCN(4–3)/CO(1–0), HCO+(4–3)/CO(1–0), HCN/HCO+(4–3), and HCN/HCO+(1–0). Here, only regions with velocity-integrated line intensities exceeding 3σ for both lines are included, with the remaining pixels shown as blank. For the maps involving HCN(4–3) or HCO+(4–3), we applied a selection where both HCN(4–3) and HCO+(4–3) have S/N ≥ 3, with the remaining points marked as hatched. For the HCN/HCO+(1–0) map, we used a similar S/N ≥ 3 filter for both HCN(1–0) and HCO+(1–0). Similar to Fig. 1, we use red rectangles to indicate the disk-dominated region and a cone with a base of 300 pc and an opening angle of 20° to represent the regions associated with outflow.
Current usage metrics show cumulative count of Article Views (full-text article views including HTML views, PDF and ePub downloads, according to the available data) and Abstracts Views on Vision4Press platform.
Data correspond to usage on the plateform after 2015. The current usage metrics is available 48-96 hours after online publication and is updated daily on week days.
Initial download of the metrics may take a while.