Open Access
Fig. A.1.
Download original image
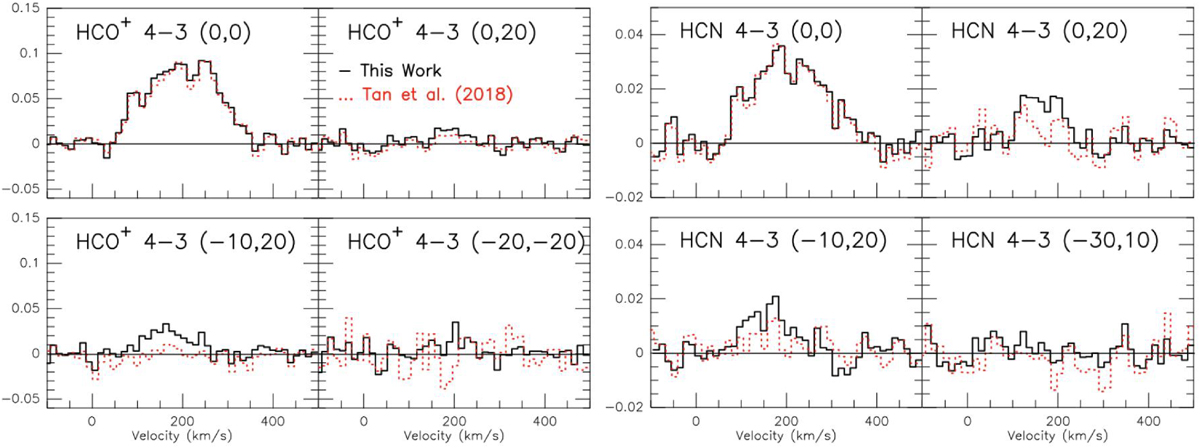
Selection of spectra in units of TA (K) from this work and Tan et al. 2018 are compared using solid black lines and red dotted lines, respectively. Each panel is labeled with the tracer, and the position pointed at is provided as an offset along the major and minor axes.
Current usage metrics show cumulative count of Article Views (full-text article views including HTML views, PDF and ePub downloads, according to the available data) and Abstracts Views on Vision4Press platform.
Data correspond to usage on the plateform after 2015. The current usage metrics is available 48-96 hours after online publication and is updated daily on week days.
Initial download of the metrics may take a while.