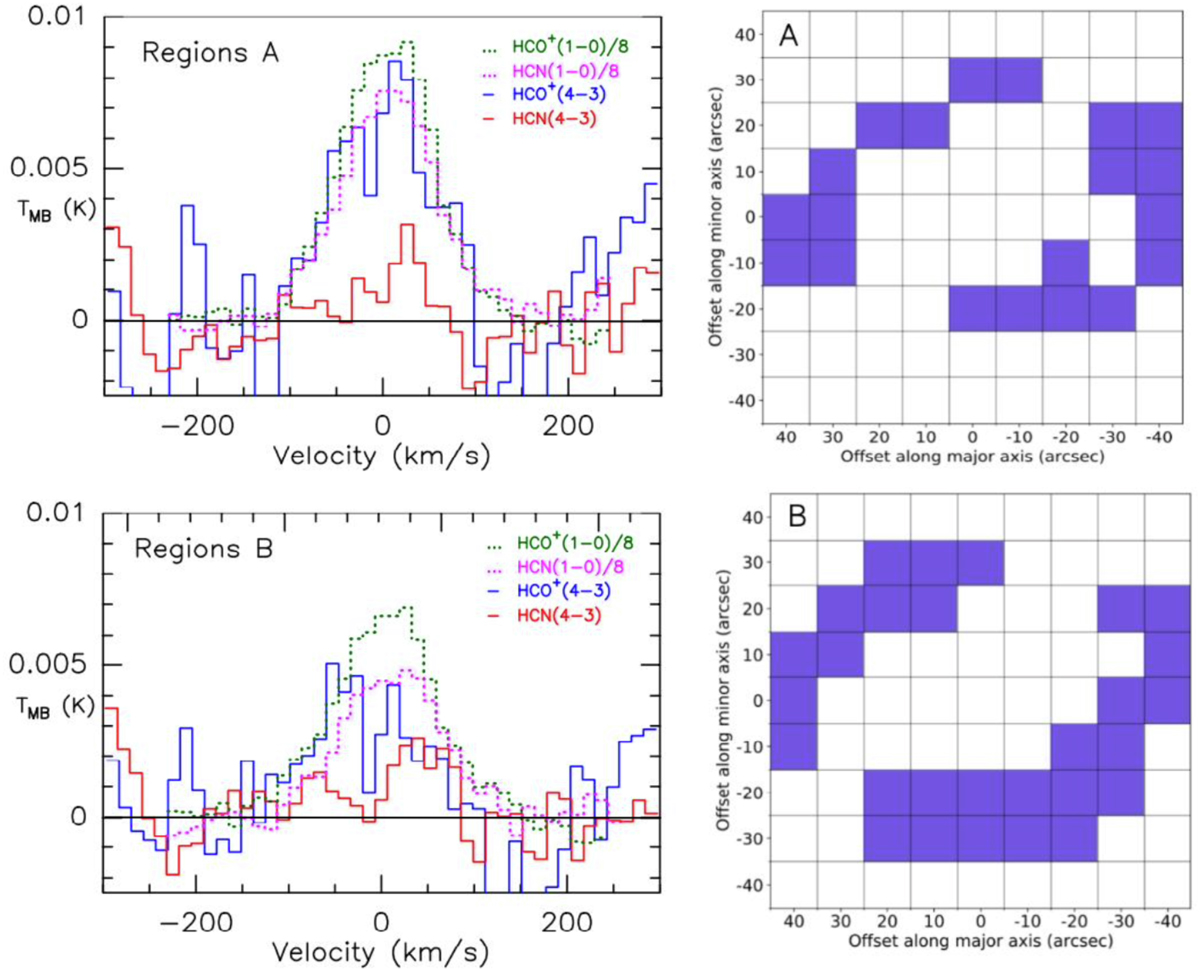
Fig. A.2.
Download original image
RMS-weighted stacked spectra for region A and region B are shown in the left panel. Region A represents areas where HCN(1–0) is detected but HCN(4–3) is not, while region B corresponds to areas where HCO+(1–0) is detected but HCO+(4–3) is not. To minimize interference from high-noise spectra, data points at offsets along the minor axis of ±40 have been excluded. The specific locations of regions A and B are shown in the right panel.
Current usage metrics show cumulative count of Article Views (full-text article views including HTML views, PDF and ePub downloads, according to the available data) and Abstracts Views on Vision4Press platform.
Data correspond to usage on the plateform after 2015. The current usage metrics is available 48-96 hours after online publication and is updated daily on week days.
Initial download of the metrics may take a while.