Open Access
Fig. D.1
Download original image
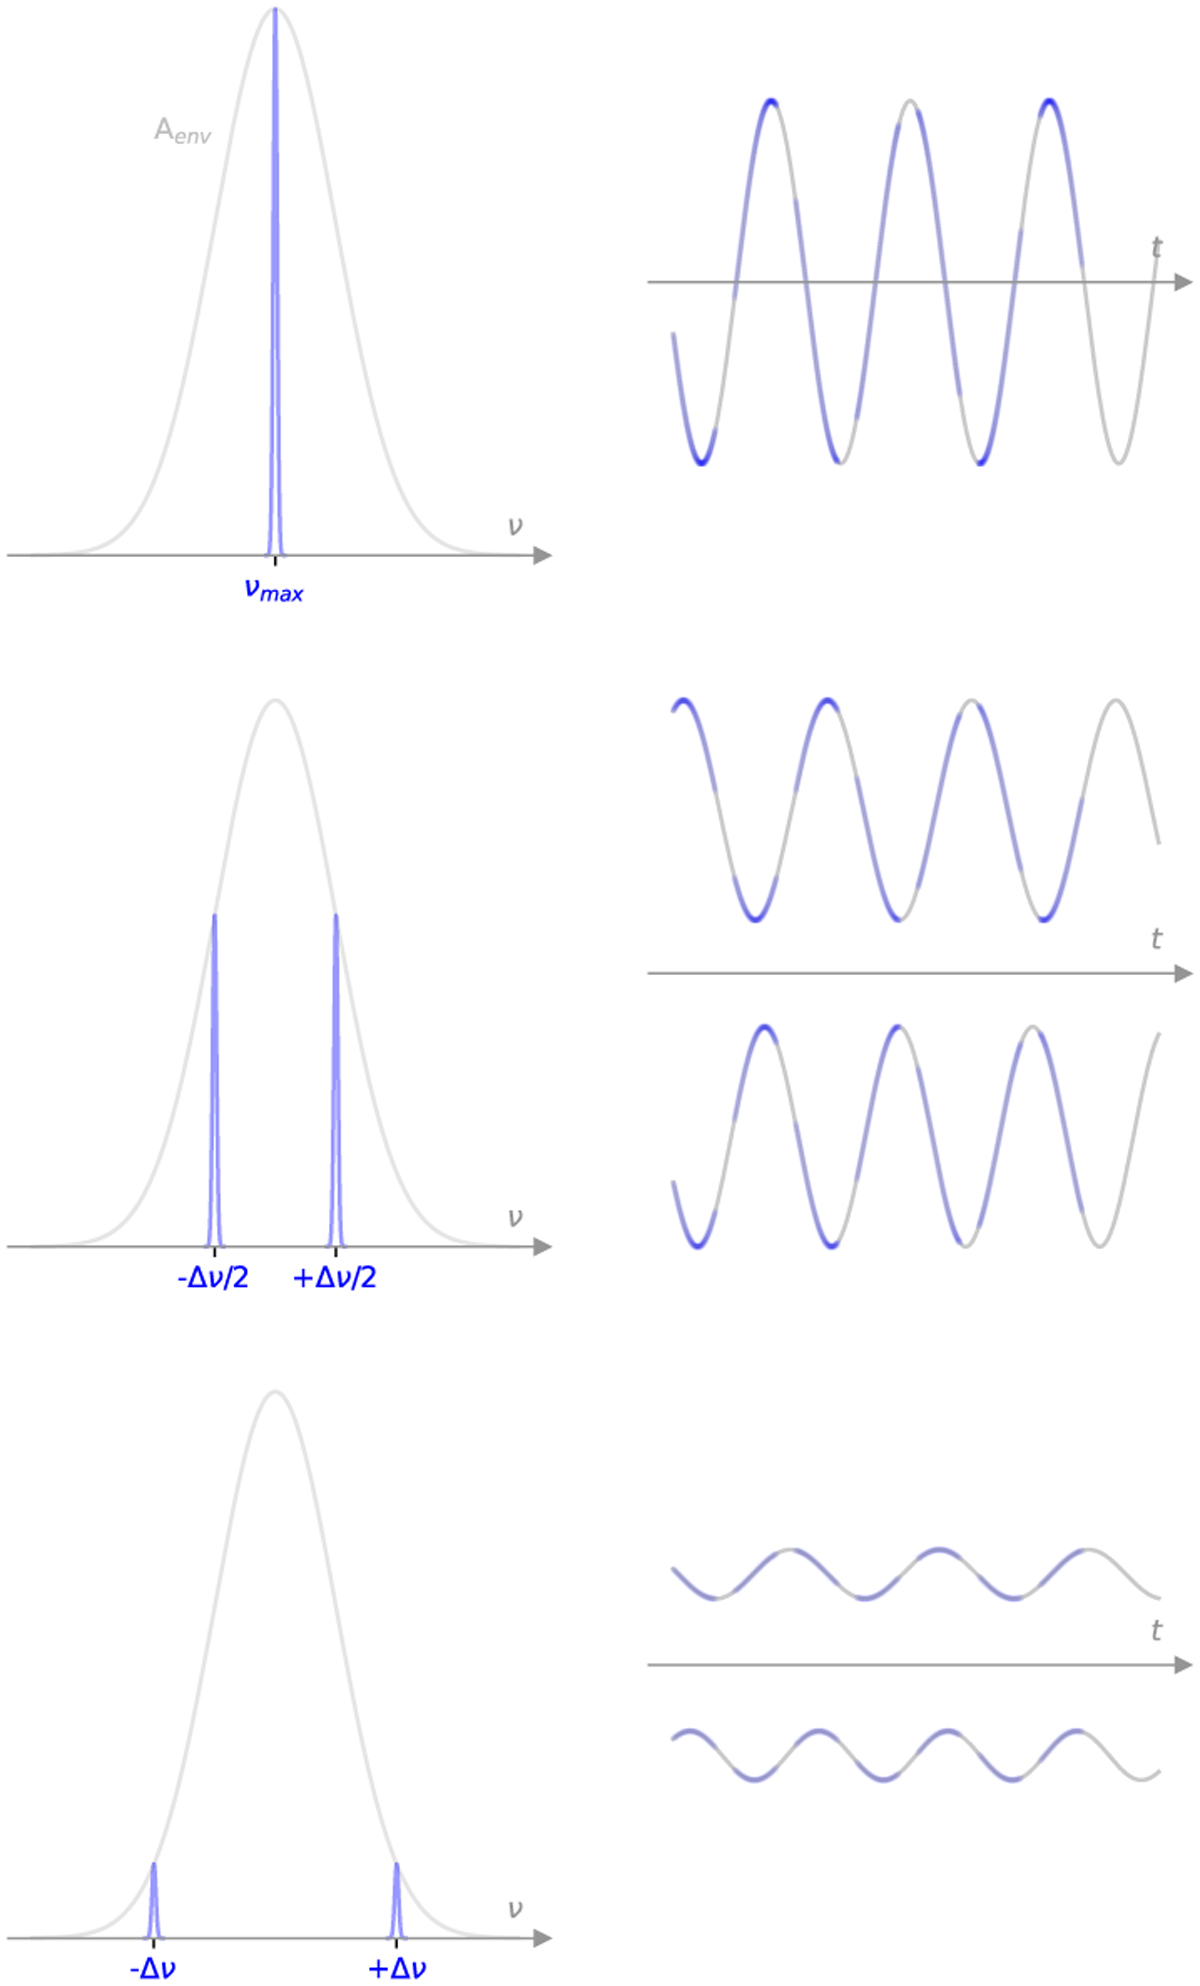
Representation on the frequencies and amplitudes drawn from the modes envelope (left), and how these plus random phases create the signals in the temporal domain (right). From top to bottom we have the main frequency νmax, plus first and second order terms. In the temporal domain, open shutter is represented in blue.
Current usage metrics show cumulative count of Article Views (full-text article views including HTML views, PDF and ePub downloads, according to the available data) and Abstracts Views on Vision4Press platform.
Data correspond to usage on the plateform after 2015. The current usage metrics is available 48-96 hours after online publication and is updated daily on week days.
Initial download of the metrics may take a while.