Fig. 6
Download original image
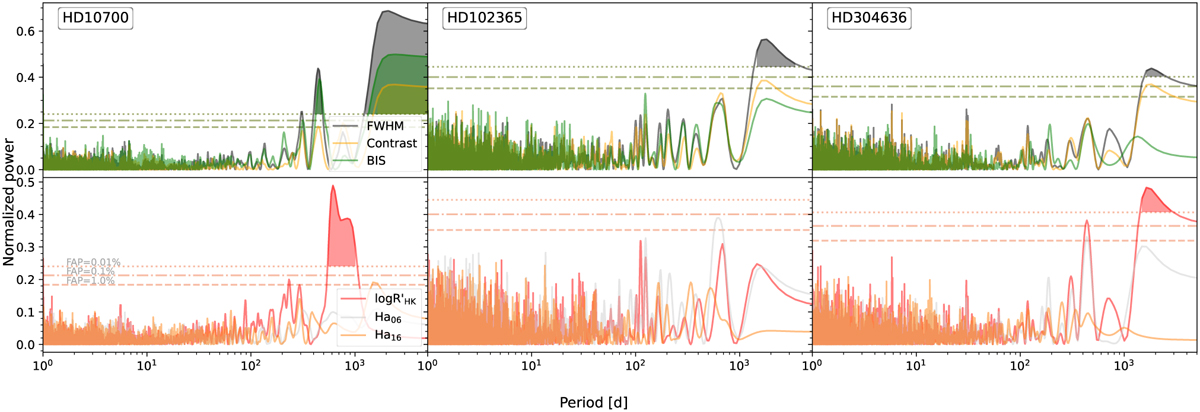
Lomb-Scargle periodogram for the activity indicators for the stars HD 10700 (left), HD 102365 (centre), and HD 304636 (right). On the upper panels we have the photospheric indicators FWHM, line contrast, and BIS, and on the bottom on we have ![]() and the two Ha parametrisations. The FAP levels of 1, 0.1, and 0.01% are shown as horizontal grey lines.
and the two Ha parametrisations. The FAP levels of 1, 0.1, and 0.01% are shown as horizontal grey lines.
Current usage metrics show cumulative count of Article Views (full-text article views including HTML views, PDF and ePub downloads, according to the available data) and Abstracts Views on Vision4Press platform.
Data correspond to usage on the plateform after 2015. The current usage metrics is available 48-96 hours after online publication and is updated daily on week days.
Initial download of the metrics may take a while.