Fig. 2.
Download original image
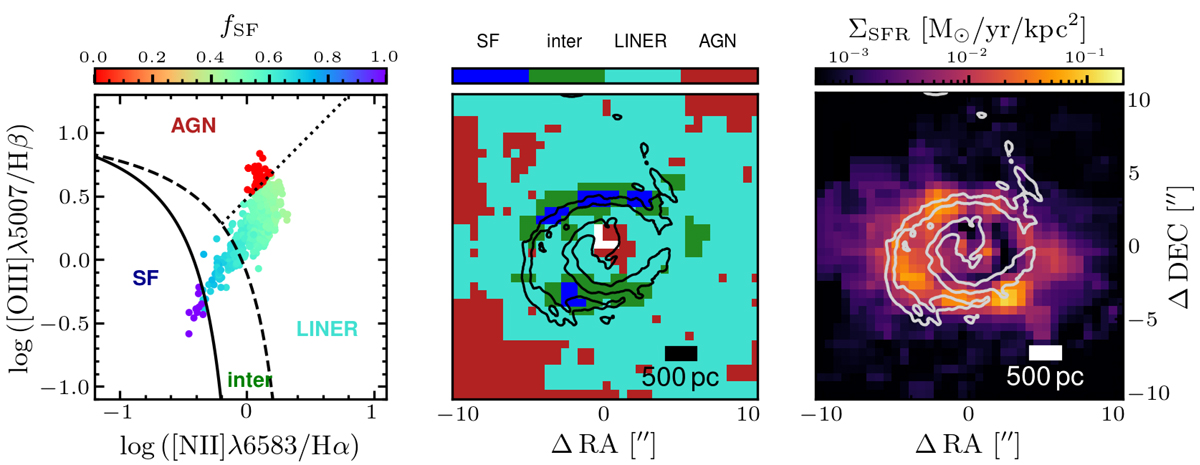
Star formation rate across the molecular gas spiral. The left panel shows the BPT diagnostic diagram for the combined MUSE WFM+NFM emission line maps, binned to 100 pc resolution. Ionised gas in NGC 4593’s innermost 1.3 kpc form a mixing sequence, with the star-forming fraction fSF modelled using Rainbow. The right panel shows the resulting star formation rate surface density (ΣSFR), overlaid with molecular gas spiral contours. Although the spatial distribution of ΣSFR roughly aligns with the molecular gas, the peaks of the two structures are offset by up to ∼200 pc.
Current usage metrics show cumulative count of Article Views (full-text article views including HTML views, PDF and ePub downloads, according to the available data) and Abstracts Views on Vision4Press platform.
Data correspond to usage on the plateform after 2015. The current usage metrics is available 48-96 hours after online publication and is updated daily on week days.
Initial download of the metrics may take a while.