Fig. 3.
Download original image
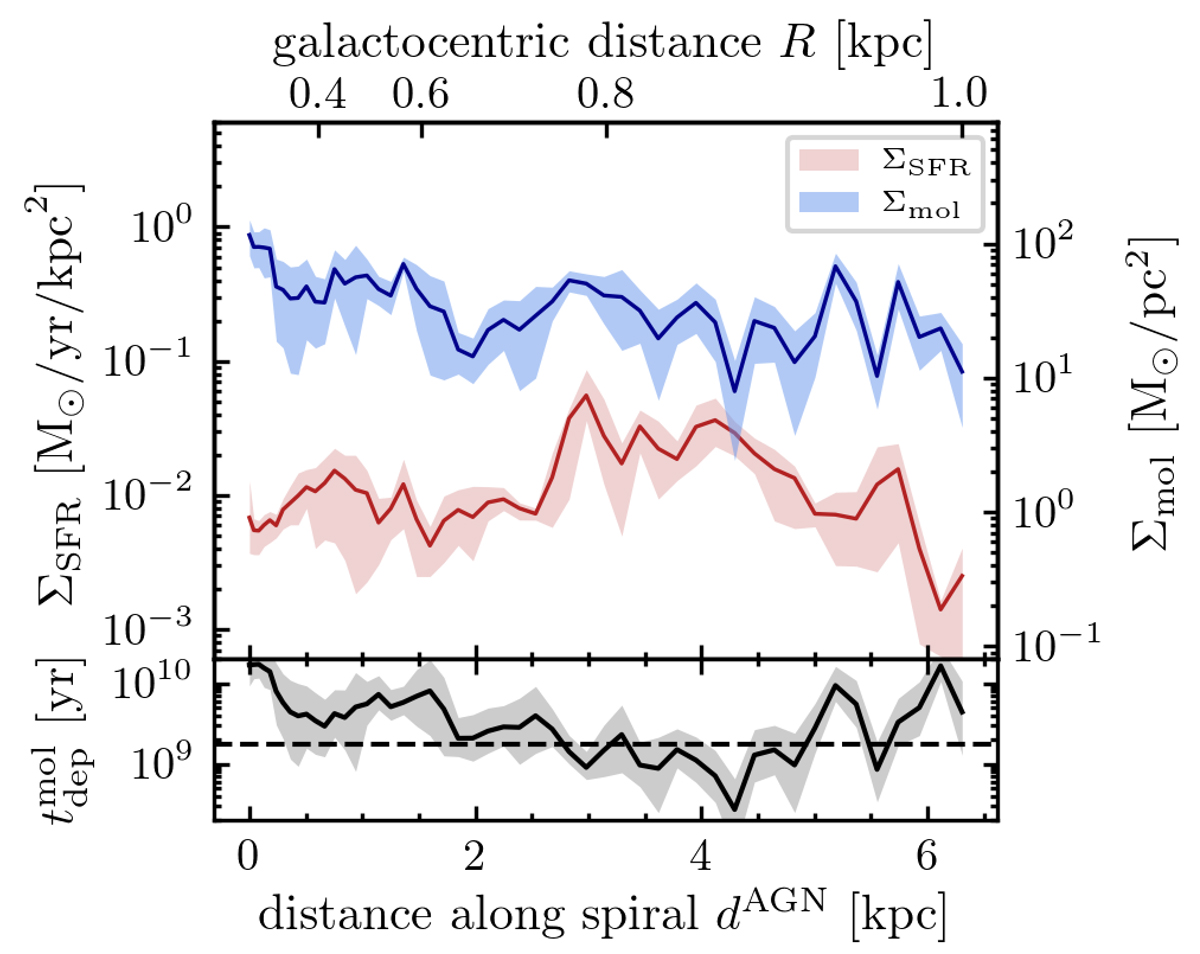
Star formation rate, molecular gas density, and depletion timescale along the single-arm spiral. The top panel shows the SFR surface density ΣSFR (red) and the molecular gas mass surface density Σmol (blue) as function of distance to the AGN measured along the spiral arm. While the Σmol has high values all across the spiral, the SF is clumped, resulting in variations of ΣSFR by more than one order of magnitude. The bottom panel shows the molecular gas mass depletion timescale, with the dashed line marking the typical ![]() measured by resolved observations in nearby spiral galaxies (Utomo et al. 2018). In the single arm spiral, it is nearly constant with a median
measured by resolved observations in nearby spiral galaxies (Utomo et al. 2018). In the single arm spiral, it is nearly constant with a median ![]() indicating that star formation in the single-arm spiral is remarkably inefficient.
indicating that star formation in the single-arm spiral is remarkably inefficient.
Current usage metrics show cumulative count of Article Views (full-text article views including HTML views, PDF and ePub downloads, according to the available data) and Abstracts Views on Vision4Press platform.
Data correspond to usage on the plateform after 2015. The current usage metrics is available 48-96 hours after online publication and is updated daily on week days.
Initial download of the metrics may take a while.