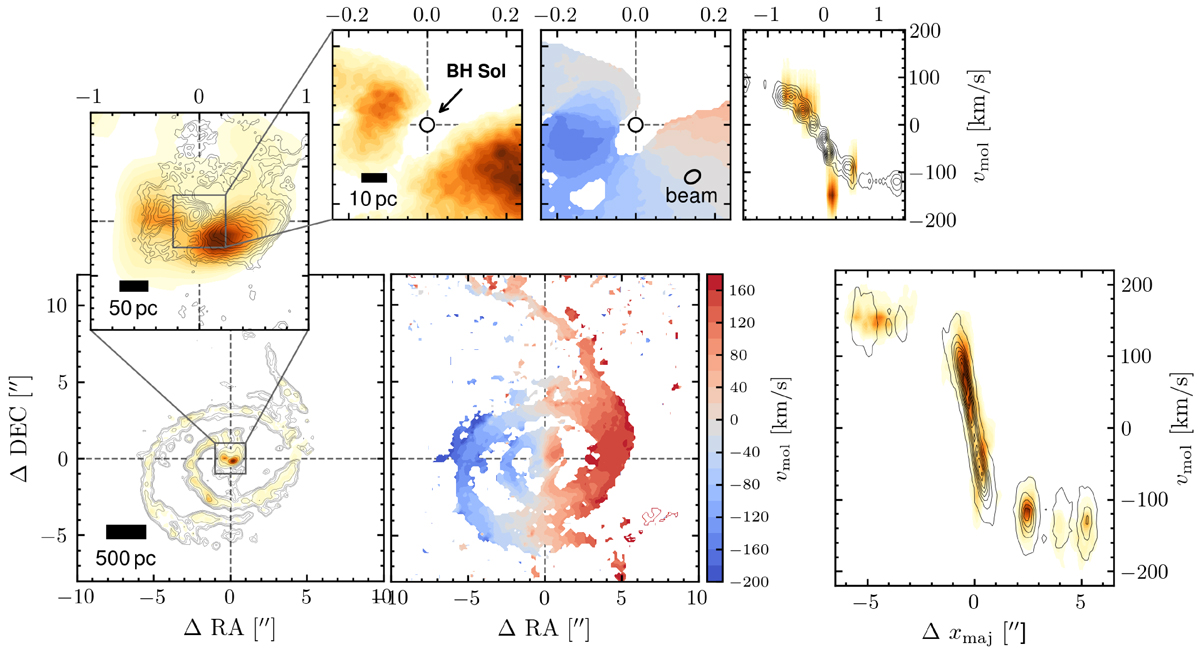
Fig. 4.
Download original image
Results of the kinematic modelling carried out with KinMS. Left: Surface brightness distribution and line-of-sight velocity field of the CO(2−1) emission for the low- (bottom) and high-resolution (top) data set, respectively. Contours correspond to the best-fit model. Right: Position-velocity diagram along the kinematic major axis. The model includes circular rotation with radial motions, which dominate the bulk molecular gas kinematics from 1.3 kpc down to the black hole SOI.
Current usage metrics show cumulative count of Article Views (full-text article views including HTML views, PDF and ePub downloads, according to the available data) and Abstracts Views on Vision4Press platform.
Data correspond to usage on the plateform after 2015. The current usage metrics is available 48-96 hours after online publication and is updated daily on week days.
Initial download of the metrics may take a while.