Fig. 5.
Download original image
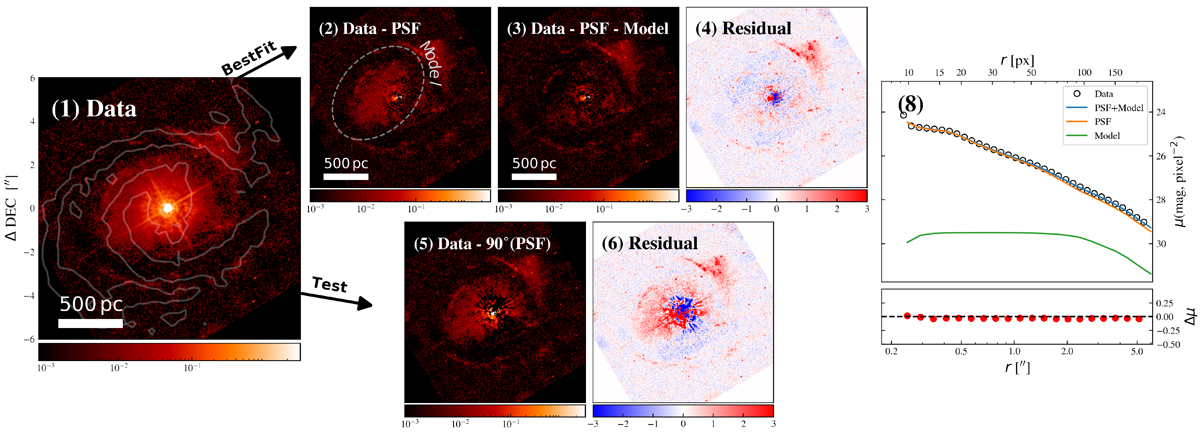
Photometric decomposition results using lenstronomy. (1) HST/ACS HRC F330W flux map with saturated pixels replaced. Grey lines show surface brightness contours of Σmol. (2) F330W flux map after subtracting the PSF model, revealing a diffuse component near the centre. Dashed contours show the initial guess of the single-Sérsic model fit to this structure. (3) F330W residual image after subtracting both the PSF and best-fit single-Sérsic model. (4) Residual map normalized by uncertainty. (5) Same as (3) but subtracting a 90°-rotated PSF from the original image. (6) Similar to (4) but the single-Sérsic model was not subtracted. The detection of the diffuse component near the AGN does not depend on the PSF subtraction (2 vs 5). Aside from compact UV emission from star-forming clumps in the single-arm spiral, no extended UV emission is left over when a single-Sérsic model is subtracted.
Current usage metrics show cumulative count of Article Views (full-text article views including HTML views, PDF and ePub downloads, according to the available data) and Abstracts Views on Vision4Press platform.
Data correspond to usage on the plateform after 2015. The current usage metrics is available 48-96 hours after online publication and is updated daily on week days.
Initial download of the metrics may take a while.