Fig. 1.
Download original image
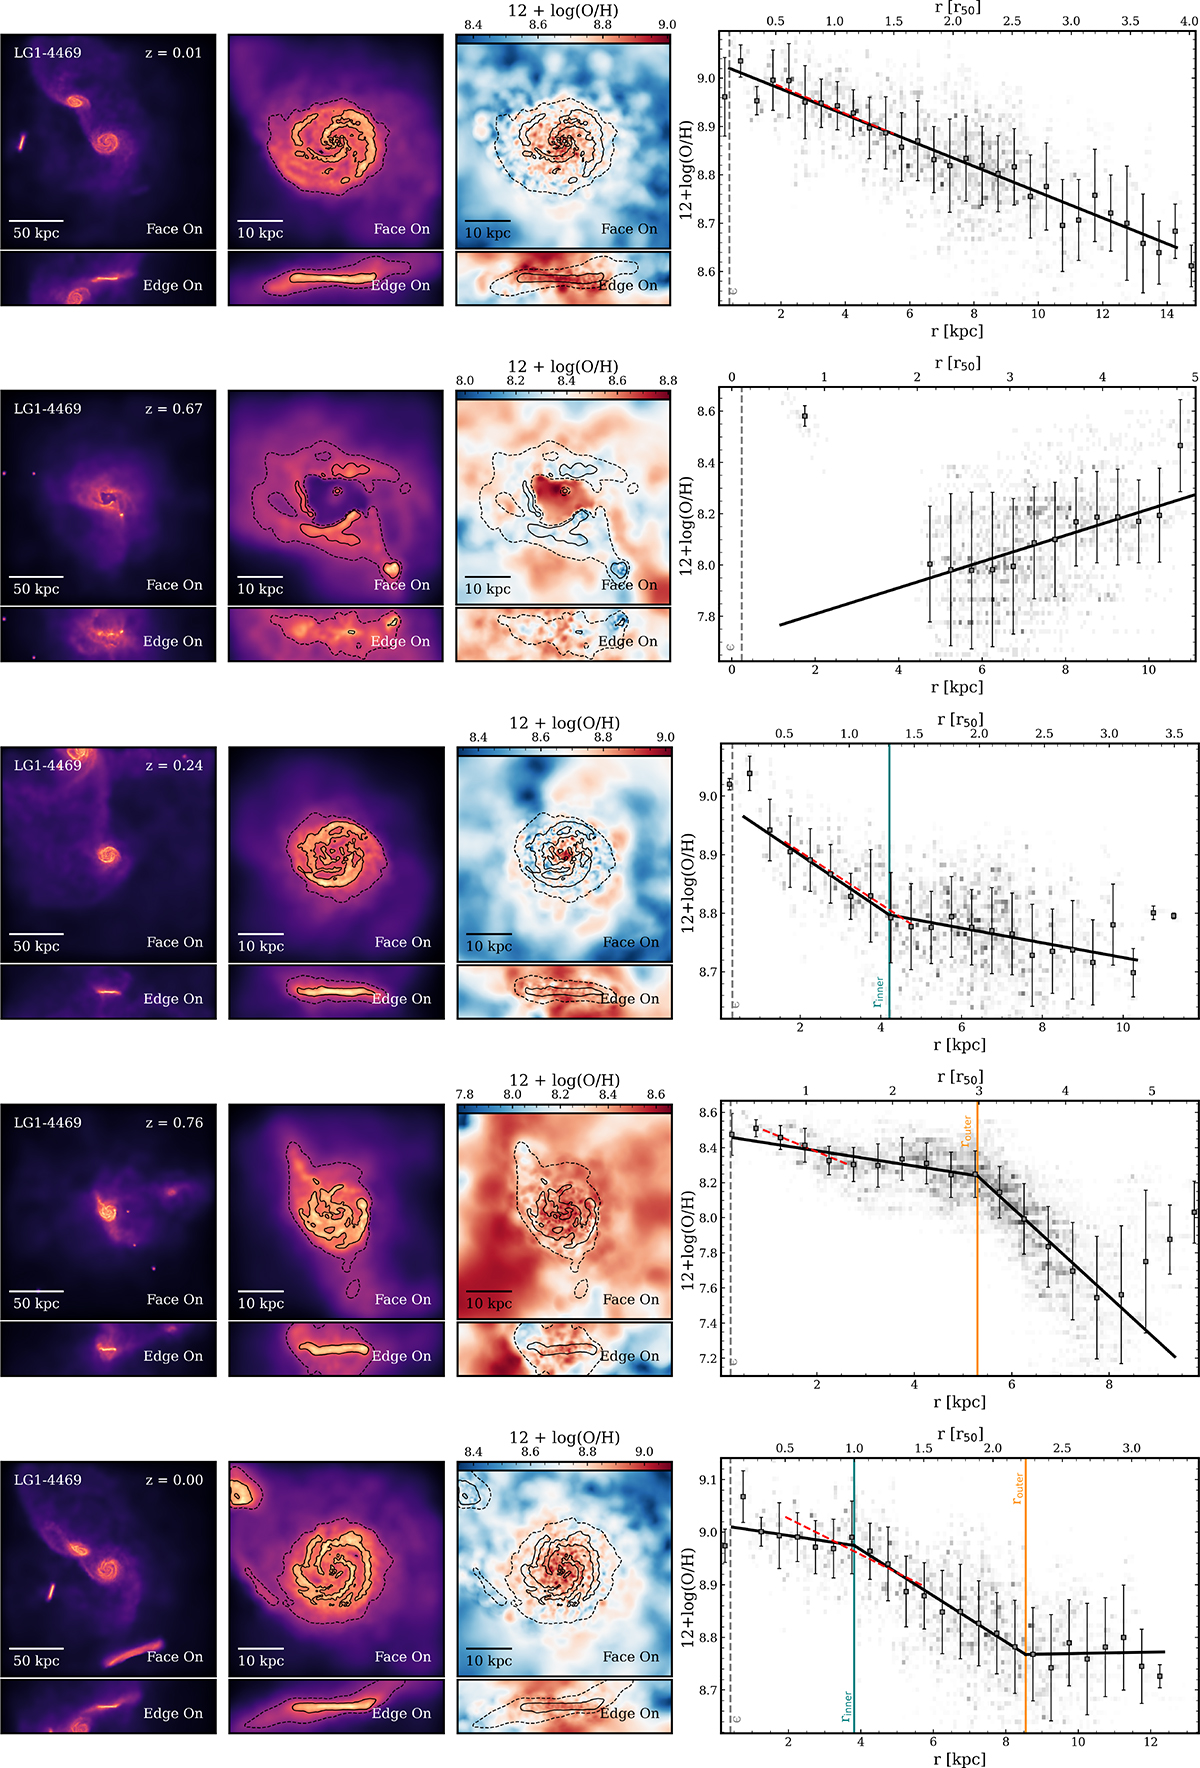
Examples of the variety of metallicity profiles in the CIELO galaxies. From left to right: (i) Face-on and edge-on (top and bottom subpanels) gas density projections in a large cubic volume of 200 kpc-side centered at a central galaxy. (ii) Face-on and edge-on gas density projections in a cubic volume of 50 kpc-side located at the center of mass of the galaxy. (iii) Face-on and edge-on projected metallicity maps in the 50 kpc-side volume. Arbitrary density contours are included in (ii) and (iii) to illustrate the morphology. (iv) Gas-phase metallicity profile of the central galaxy (background heat map). For illustrative purposes, median values within 0.5 kpc bins are shown as filled squares, with error bars indicating the standard deviation in each bin. The DB-A fit adopted in this work (see Sect. 2.2) is shown as a black solid line. For comparison, a linear fit within [0.5–1.5] r50 is also displayed (red dashed line). Vertical lines are included to indicate the gravitational softening ϵ (gray, dashed line), inner break radii (teal solid line) and/or outer break radii (orange solid line) when appropriate.
Current usage metrics show cumulative count of Article Views (full-text article views including HTML views, PDF and ePub downloads, according to the available data) and Abstracts Views on Vision4Press platform.
Data correspond to usage on the plateform after 2015. The current usage metrics is available 48-96 hours after online publication and is updated daily on week days.
Initial download of the metrics may take a while.