Fig. 11.
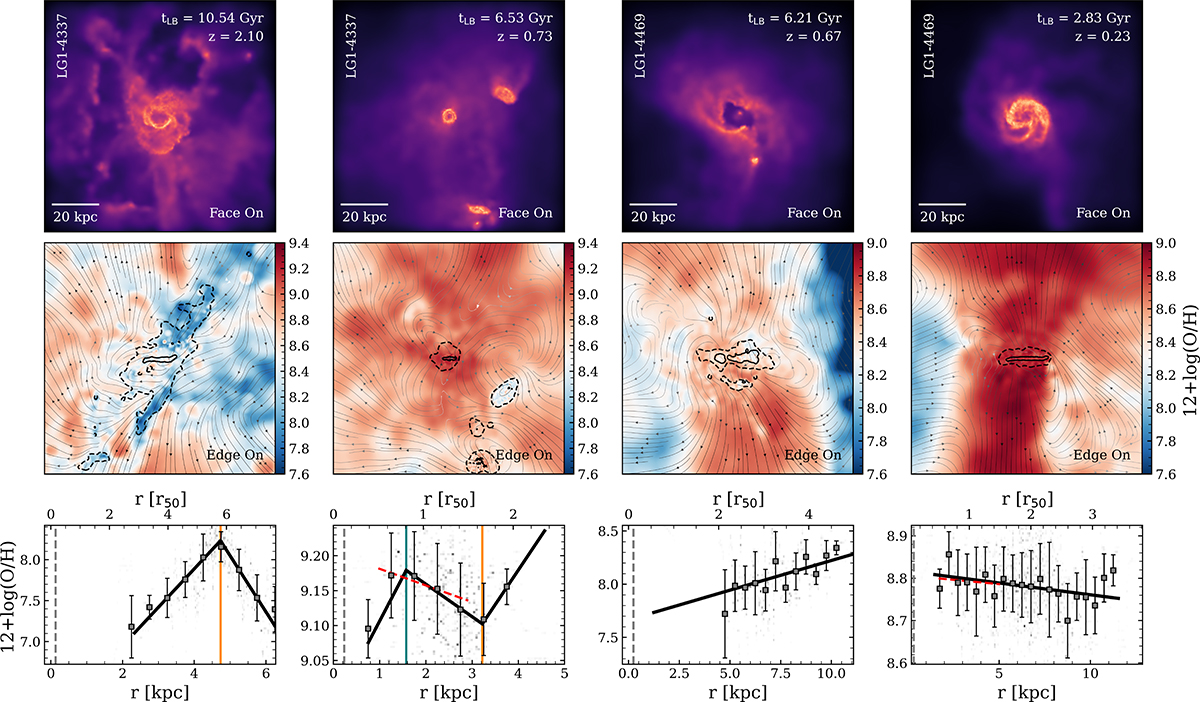
Download original image
Examples of morphologically disrupted galaxies showing evidence of central gas ejection driven by strong energetic feedback. The top row displays face-on gas density projections; the middle row shows edge-on metallicity maps with streamlines indicating gas velocity directions; and the bottom row presents metallicity profiles, formatted as in Figs.1 and 10. The corresponding galaxy and lookback time/redshift are labeled in the upper panels.
Current usage metrics show cumulative count of Article Views (full-text article views including HTML views, PDF and ePub downloads, according to the available data) and Abstracts Views on Vision4Press platform.
Data correspond to usage on the plateform after 2015. The current usage metrics is available 48-96 hours after online publication and is updated daily on week days.
Initial download of the metrics may take a while.