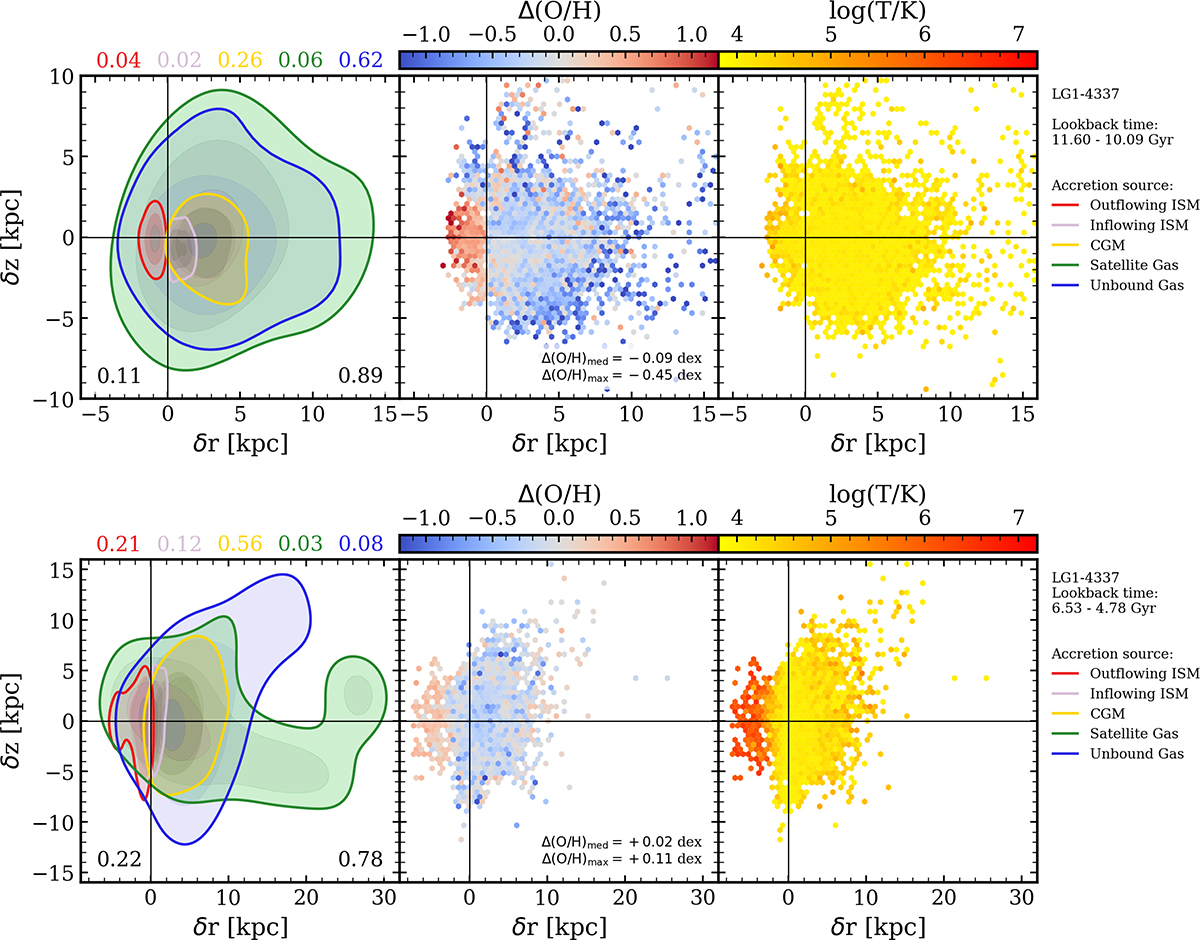
Fig. 12.
Download original image
Diagrams of δr − δz showing the motion of the gas accreted into the outer region of LG1-4337 from different sources (similar to Fig. 9) between lookback time 11.60 Gyr and 10.1 Gyr (upper panels) and between lookback time 6.5 Gyr and 4.9 Gyr (lower panels). The diagrams in the upper panels illustrate the accretion of a high-z galaxy that exhibits an outer drop, with a dominant contribution from metal-poor unbound gas (62% of the accreted gas). The diagrams in the lower panels illustrate a low-z galaxy with an outer rise, with the clear indication recycled metal-rich gas from the CGM being the main source of accretion (56% of the accreted gas).
Current usage metrics show cumulative count of Article Views (full-text article views including HTML views, PDF and ePub downloads, according to the available data) and Abstracts Views on Vision4Press platform.
Data correspond to usage on the plateform after 2015. The current usage metrics is available 48-96 hours after online publication and is updated daily on week days.
Initial download of the metrics may take a while.