Fig. B.1.
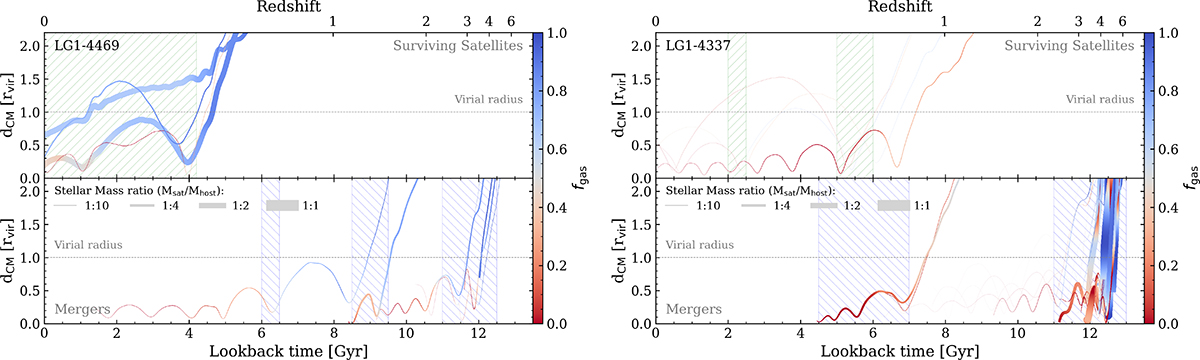
Download original image
Time evolution of the physical separation between the center of mass of the central galaxy (left panel: LG1-4469; right panel: LG1-4337) and its surviving satellites (upper panel) and merged galaxies (lower panel). Each continuous line represents a different satellite or merged galaxy, with line thickness proportional to their stellar mass ratio. The line color indicates the gas fraction of the satellite/merged galaxy at different stages of the interaction. Key events are highlighted with green and blue shaded regions, consistent with those shown in Fig. 8.
Current usage metrics show cumulative count of Article Views (full-text article views including HTML views, PDF and ePub downloads, according to the available data) and Abstracts Views on Vision4Press platform.
Data correspond to usage on the plateform after 2015. The current usage metrics is available 48-96 hours after online publication and is updated daily on week days.
Initial download of the metrics may take a while.