Fig. 2.
Download original image
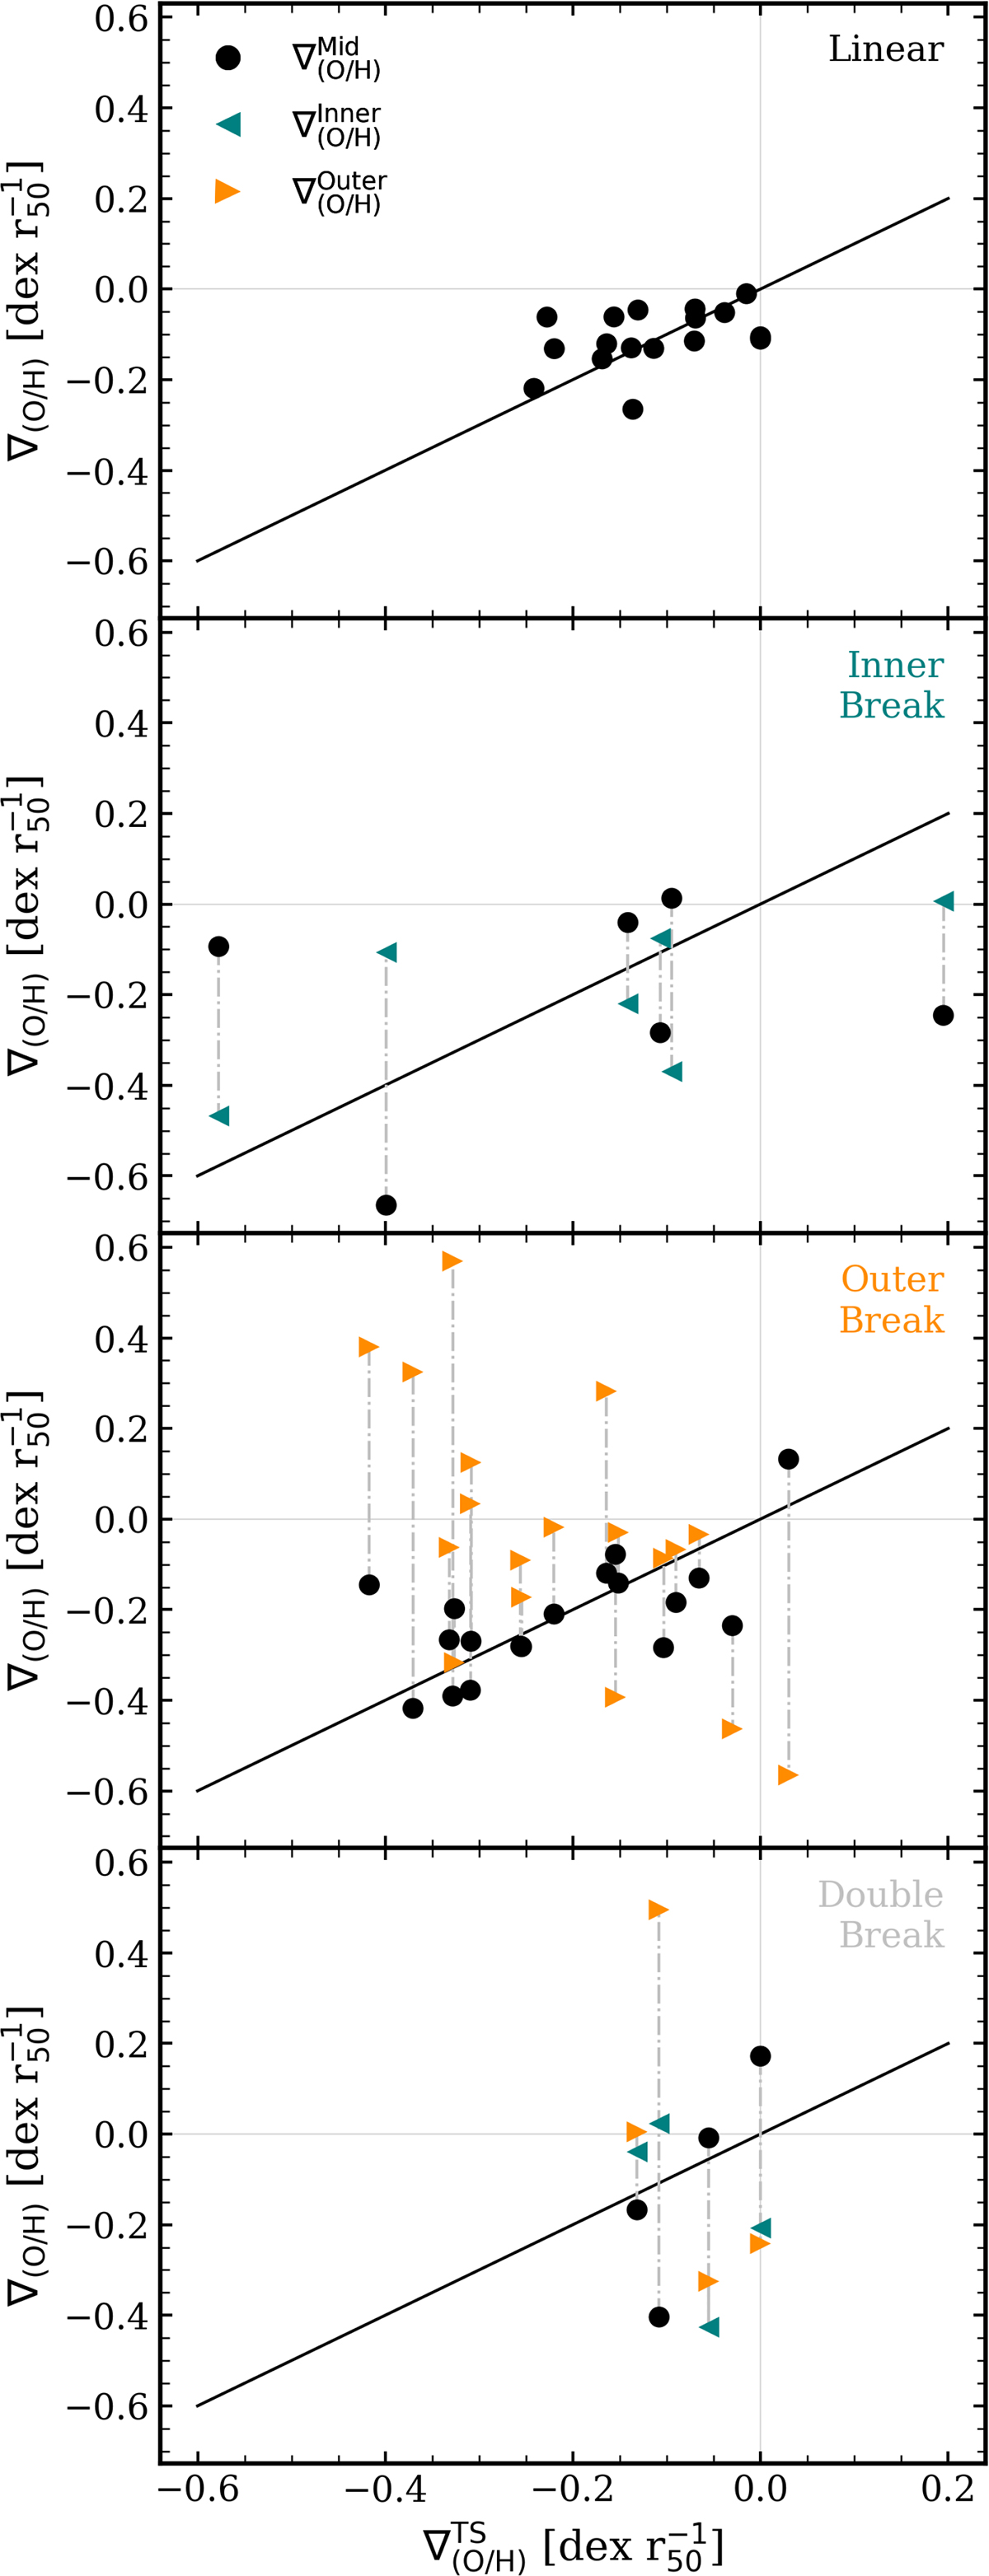
Comparison between the metallicity gradients (filled black circles) estimated by the DB-A fit, ![]() , and by the Theil-Sen method,
, and by the Theil-Sen method, ![]() , for galaxies exhibiting, from top to bottom, (i) linear profiles, (ii) inner break profiles, (iii) outer break profiles, and (iv) double break profiles. When corresponds, inner (teal symbols) and outer (orange symbols) metallicity gradients are also shown. Vertical lines are included as a visual aid to identify gradients belonging to the same galaxy.
, for galaxies exhibiting, from top to bottom, (i) linear profiles, (ii) inner break profiles, (iii) outer break profiles, and (iv) double break profiles. When corresponds, inner (teal symbols) and outer (orange symbols) metallicity gradients are also shown. Vertical lines are included as a visual aid to identify gradients belonging to the same galaxy.
Current usage metrics show cumulative count of Article Views (full-text article views including HTML views, PDF and ePub downloads, according to the available data) and Abstracts Views on Vision4Press platform.
Data correspond to usage on the plateform after 2015. The current usage metrics is available 48-96 hours after online publication and is updated daily on week days.
Initial download of the metrics may take a while.