Fig. 3.
Download original image
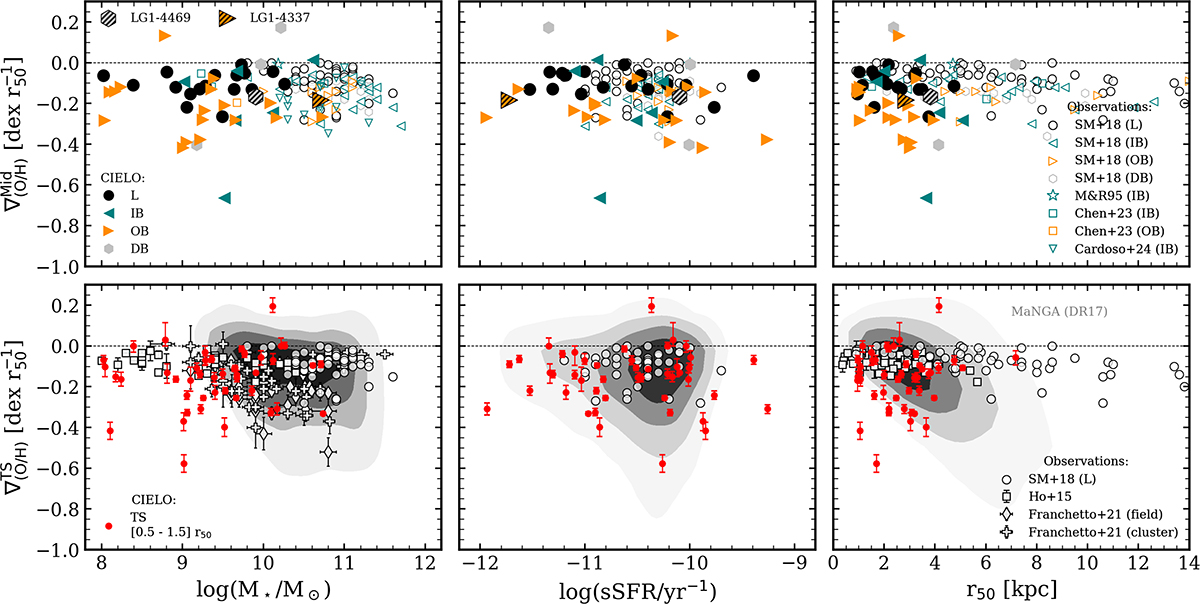
Stellar mass-, sSFR-, and size-metallicity gradient relation for the 45 star-forming central galaxies (left, middle, and right panels, respectively). In the upper panels, the relations were constructed by using only ![]() . The colors of solid symbols encode the type of profile that was best fit to the whole metallicity distribution, inner break (IB; teal triangles), outer break (OB; orange triangles), and doubly broken (DB; gray hexagons). In the lower panels are the same relations but constructed using
. The colors of solid symbols encode the type of profile that was best fit to the whole metallicity distribution, inner break (IB; teal triangles), outer break (OB; orange triangles), and doubly broken (DB; gray hexagons). In the lower panels are the same relations but constructed using ![]() (red circles). Observational data from Martin & Roy (1995), Ho et al. (2015), and SM18 (MUSE); Franchetto et al. (2021) (MaNGA+MUSE); Chen et al. (2023) (TYPHOON); Cardoso et al. (2025) (CALIFA); and MaNGA DR17 are also displayed in a similar fashion. The black dashed line indicates ∇(O/H) = 0 for reference purposes only. The two main galaxies LG1-4469 and LG1-4337 of the LG analog are highlighted, as they are later analyzed in detail as case studies.
(red circles). Observational data from Martin & Roy (1995), Ho et al. (2015), and SM18 (MUSE); Franchetto et al. (2021) (MaNGA+MUSE); Chen et al. (2023) (TYPHOON); Cardoso et al. (2025) (CALIFA); and MaNGA DR17 are also displayed in a similar fashion. The black dashed line indicates ∇(O/H) = 0 for reference purposes only. The two main galaxies LG1-4469 and LG1-4337 of the LG analog are highlighted, as they are later analyzed in detail as case studies.
Current usage metrics show cumulative count of Article Views (full-text article views including HTML views, PDF and ePub downloads, according to the available data) and Abstracts Views on Vision4Press platform.
Data correspond to usage on the plateform after 2015. The current usage metrics is available 48-96 hours after online publication and is updated daily on week days.
Initial download of the metrics may take a while.