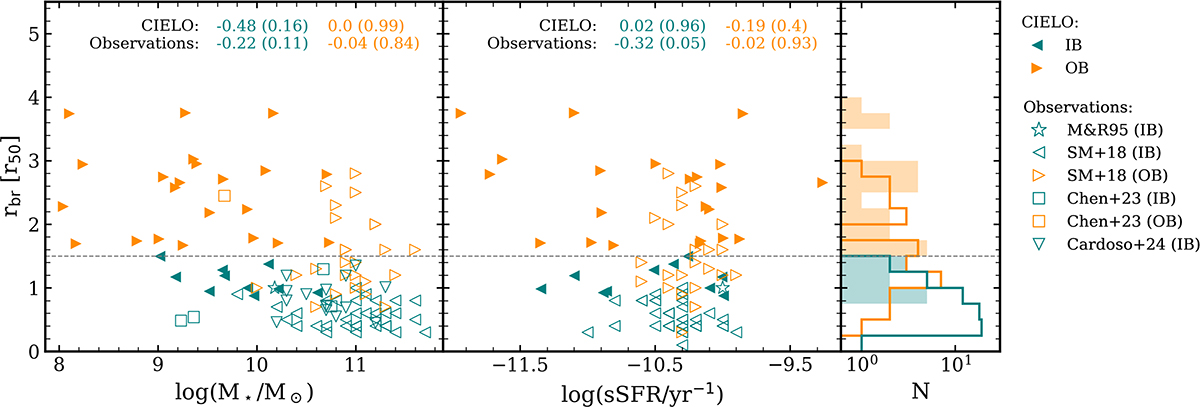
Fig. 5.
Download original image
Inner (teal symbols) and outer (orange symbols) break radii as a function of (i) galaxy stellar mass (left panel) and (ii) sSFR (right panel). The CIELO galaxies are displayed as filled symbols, while empty symbols represent observations from Martin & Roy (1995), SM18, Chen et al. (2023) and Cardoso et al. (2025) as indicated in the legend. The SCC was calculated to evaluate possible correlations between galaxy properties and inner and outer break radii. The upper part of each panel shows the SCC computed considering: CIELO galaxies (top rows) and observations (bottom rows). The p-value is shown in parenthesis in each case.
Current usage metrics show cumulative count of Article Views (full-text article views including HTML views, PDF and ePub downloads, according to the available data) and Abstracts Views on Vision4Press platform.
Data correspond to usage on the plateform after 2015. The current usage metrics is available 48-96 hours after online publication and is updated daily on week days.
Initial download of the metrics may take a while.