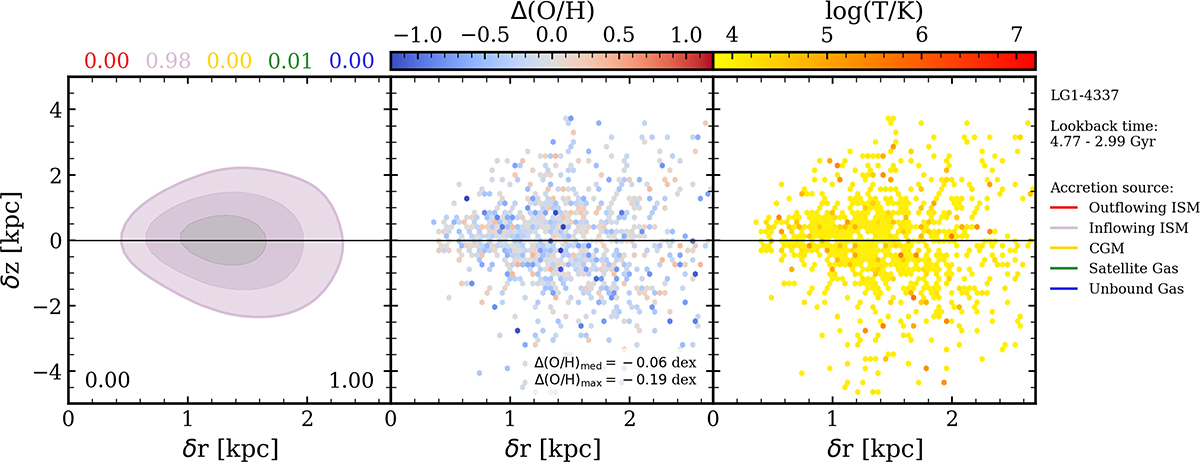
Fig. 9.
Download original image
Diagram of δr − δz illustrating the motion of the gas accreted into the inner region of LG1-4337 between lookback time ∼4.8 Gyr and ∼3 Gyr. During this period, the galaxy exhibits an inner break of its metallicity profile. Left panel: KDE distribution of the accreted particles. The colored numbers displayed at the top represent the fractional contribution of each gas accretion source, consistent with the color code used in Fig. 7 and the legend. The numbers below indicate the fraction of particles with δr < 0 (outflowing) and δr > 0 (inflowing). Central panel: Distribution of accreted particles, color coded by Δ(O/H), which represents the difference between the metallicity of the accreted gas and that of the respective region. Negative values indicate that the accreted gas is less enriched than the preexisting gas in the region. The median (med) value is computed over the entire time interval, while the maximum (max) value corresponds to the largest difference observed within that period. Right panel: Distribution of accreted gas particles colored by their temperature.
Current usage metrics show cumulative count of Article Views (full-text article views including HTML views, PDF and ePub downloads, according to the available data) and Abstracts Views on Vision4Press platform.
Data correspond to usage on the plateform after 2015. The current usage metrics is available 48-96 hours after online publication and is updated daily on week days.
Initial download of the metrics may take a while.