Fig. 1
Download original image
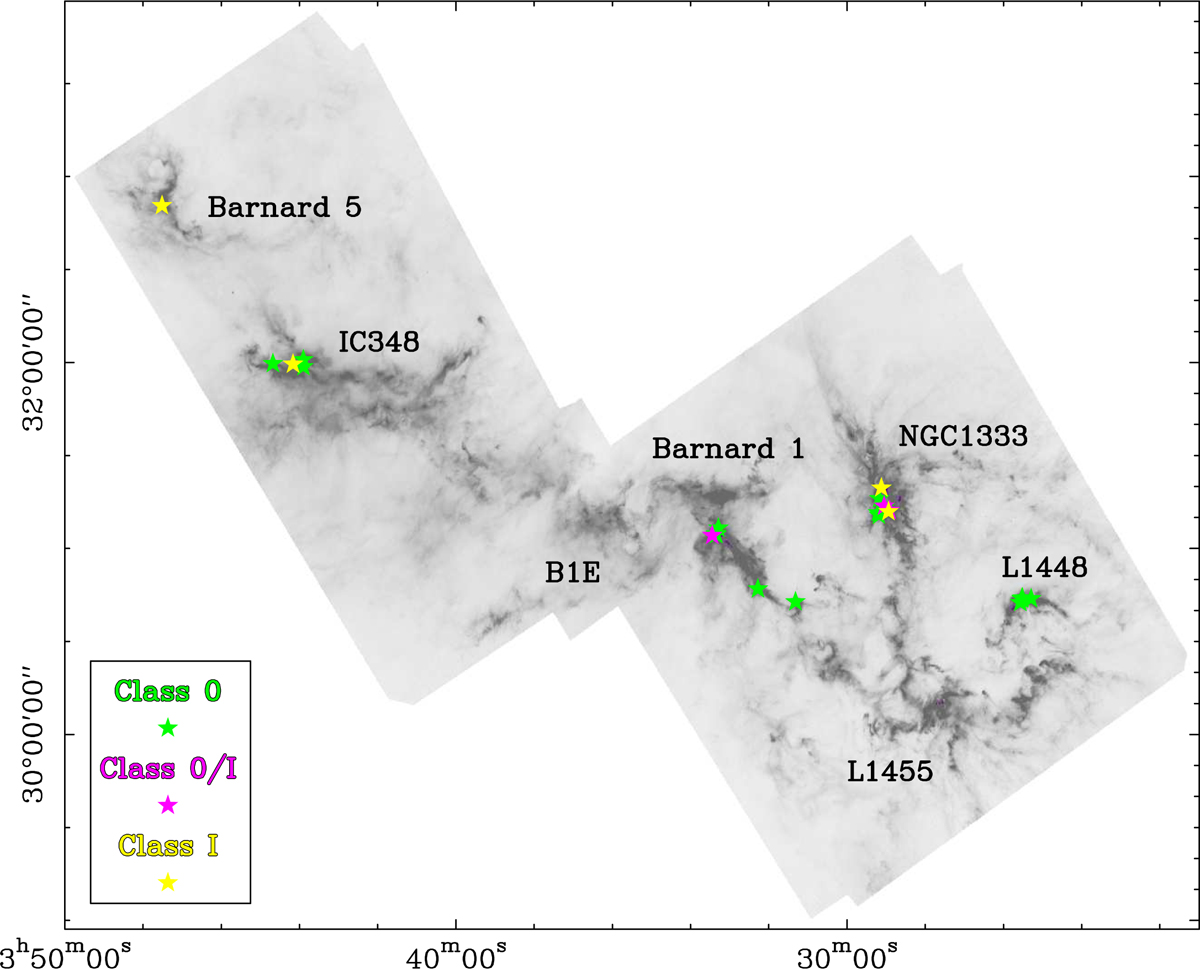
Map of the Perseus Molecular Cloud and its several subregions. Represented with stars are the positions of the 24 protostars observed in this work. Their color shows the evolutionary stage of the source. Gray-scale background shows far-infrared and submillimeter emission from the Herschel Gould Belt Survey (André et al. 2010; HGBS team 2020).
Current usage metrics show cumulative count of Article Views (full-text article views including HTML views, PDF and ePub downloads, according to the available data) and Abstracts Views on Vision4Press platform.
Data correspond to usage on the plateform after 2015. The current usage metrics is available 48-96 hours after online publication and is updated daily on week days.
Initial download of the metrics may take a while.