Fig. 11
Download original image
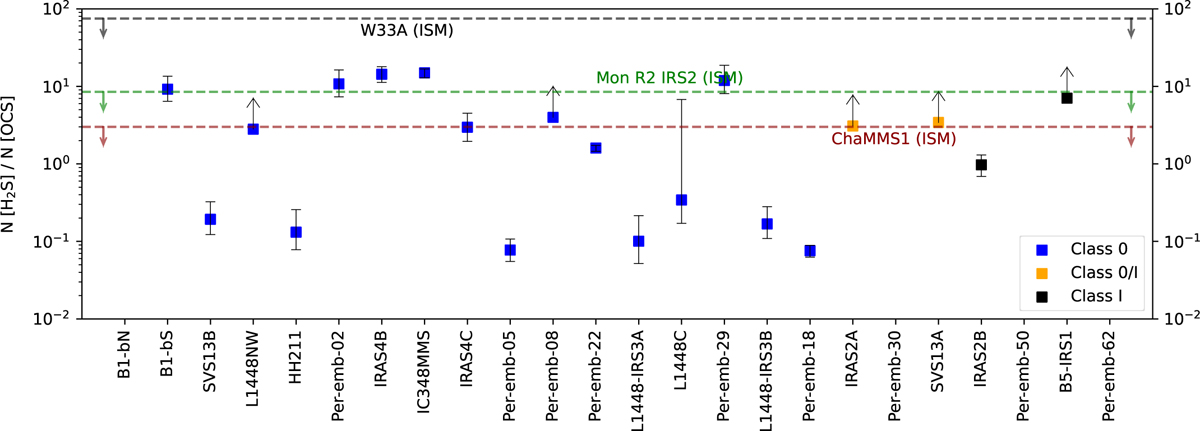
H2S/OCS ratio in the 24 protostars of our sample. The class of each protostar has been represented using the color code in the legend. Sources are sorted by class, and then ordered by increasing bolometric temperature within each class. The discontinuous horizontal lines represent different upper limits to the H2S/OCS ratio in ices from different regions: in black, W33A; in green, Mon R2 IRS2; in red, ChaMMSl. Only the OCS-rich sources are compatible with the more restrictive limit, ChaMMSl, which could give us some hints about the environment where the ice was formed.
Current usage metrics show cumulative count of Article Views (full-text article views including HTML views, PDF and ePub downloads, according to the available data) and Abstracts Views on Vision4Press platform.
Data correspond to usage on the plateform after 2015. The current usage metrics is available 48-96 hours after online publication and is updated daily on week days.
Initial download of the metrics may take a while.