Fig. A.1
Download original image
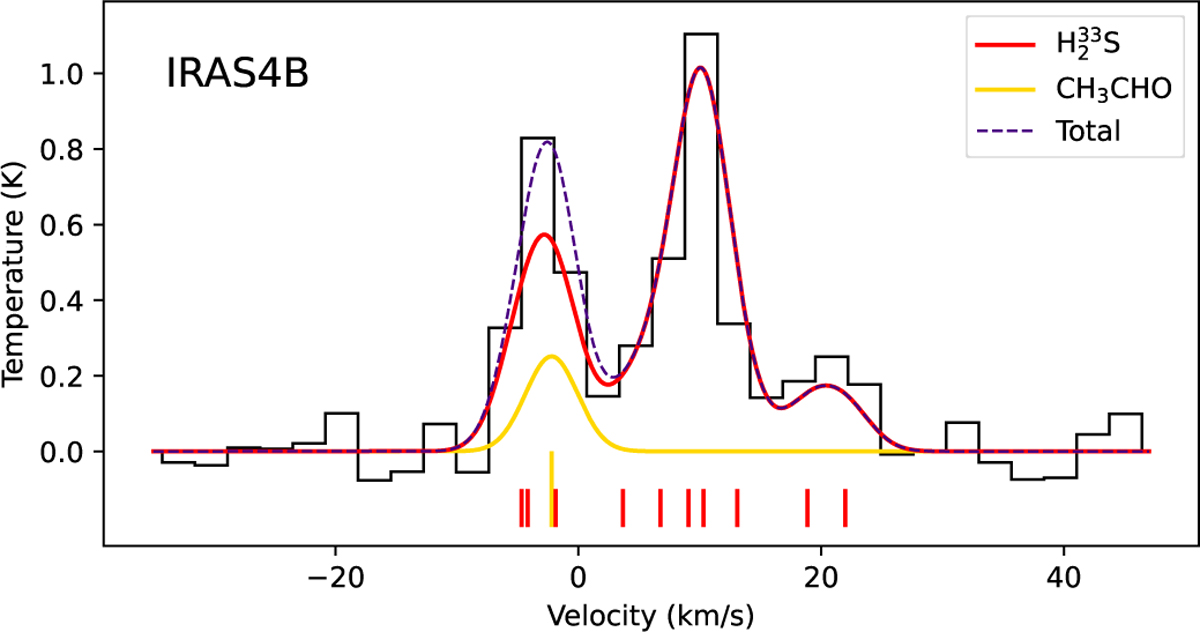
Spectrum of IRAS4B around the 215 GHz ![]() line. In black, the integrated emission in a 1.5″ circle around the protostar’s position. In red, the fit to the
line. In black, the integrated emission in a 1.5″ circle around the protostar’s position. In red, the fit to the ![]() emission. In yellow, the emission of CH3CHO, assuming its column density is three times greater than that of
emission. In yellow, the emission of CH3CHO, assuming its column density is three times greater than that of ![]() . The purple dashed line represents the sum of the emission of both species. The different lines from Table A.1 appear marked in the bottom side of the figure with small vertical lines. For reference, the most intense
. The purple dashed line represents the sum of the emission of both species. The different lines from Table A.1 appear marked in the bottom side of the figure with small vertical lines. For reference, the most intense ![]() line (the fourth starting from the left) is at a velocity of −3.1 km/s.
line (the fourth starting from the left) is at a velocity of −3.1 km/s.
Current usage metrics show cumulative count of Article Views (full-text article views including HTML views, PDF and ePub downloads, according to the available data) and Abstracts Views on Vision4Press platform.
Data correspond to usage on the plateform after 2015. The current usage metrics is available 48-96 hours after online publication and is updated daily on week days.
Initial download of the metrics may take a while.