Fig. C.1
Download original image
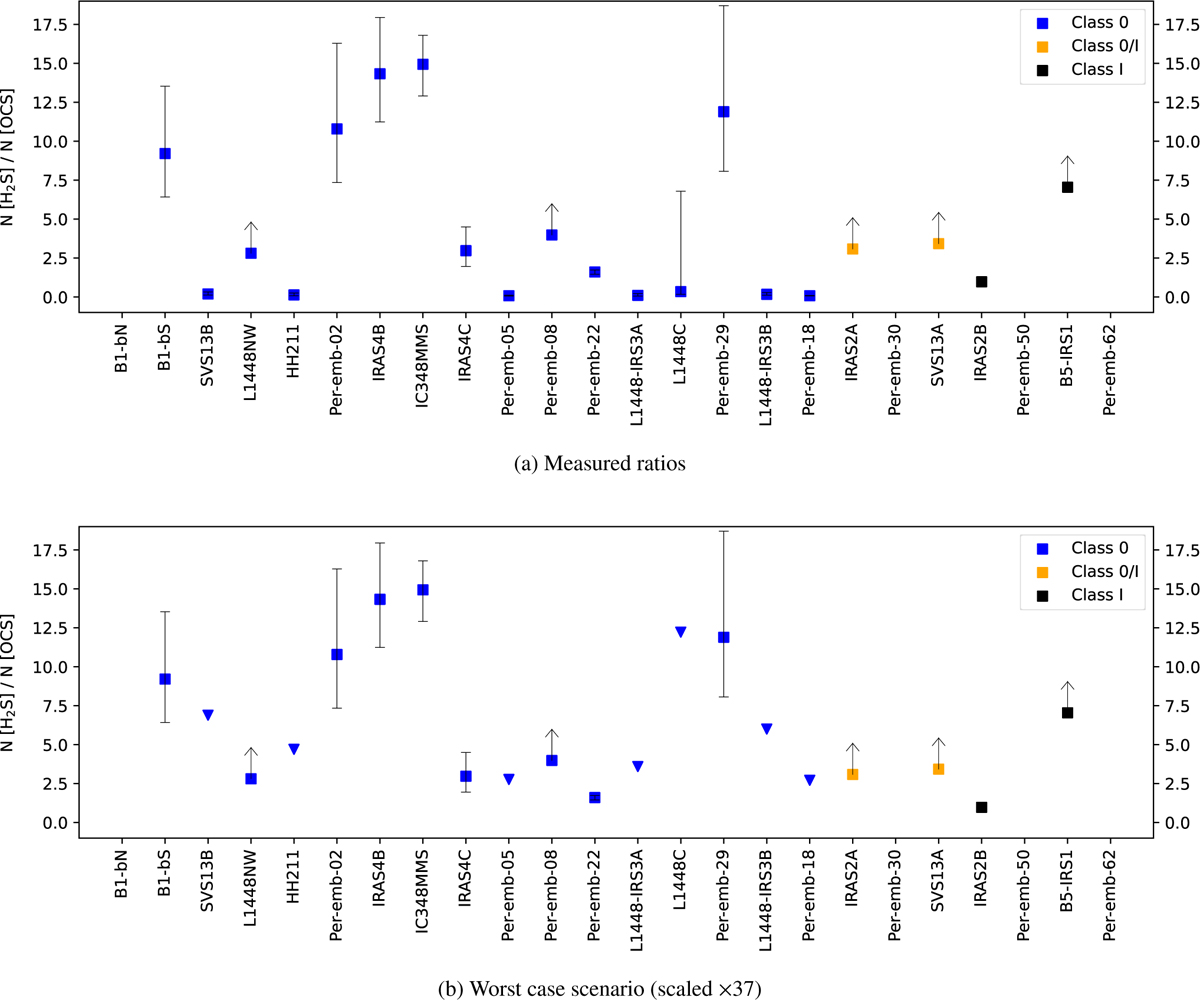
Ratio of H2S/OCS in the 24 protostars of our sample. The class of each protostar has been represented using the color code in the legend. Sources are sorted by class, and then ordered by increasing bolometric temperature within each class. Panel a) shows the ratios calculated with the estimated column densities of H2S and OCS. Panel b) shows the same data but assuming a worst-case scenario where all protostars with OC34S detection but no ![]() detection have their H2S column density scaled by a factor 37, to take into account possible optically thick emission in the H2S line. The scaled ratios have been represented with a downward triangle, which is a superior limit to the maximum expected H2S/OCS ratio after accounting for the opacity. In this case, the two differentiated trends still appear.
detection have their H2S column density scaled by a factor 37, to take into account possible optically thick emission in the H2S line. The scaled ratios have been represented with a downward triangle, which is a superior limit to the maximum expected H2S/OCS ratio after accounting for the opacity. In this case, the two differentiated trends still appear.
Current usage metrics show cumulative count of Article Views (full-text article views including HTML views, PDF and ePub downloads, according to the available data) and Abstracts Views on Vision4Press platform.
Data correspond to usage on the plateform after 2015. The current usage metrics is available 48-96 hours after online publication and is updated daily on week days.
Initial download of the metrics may take a while.