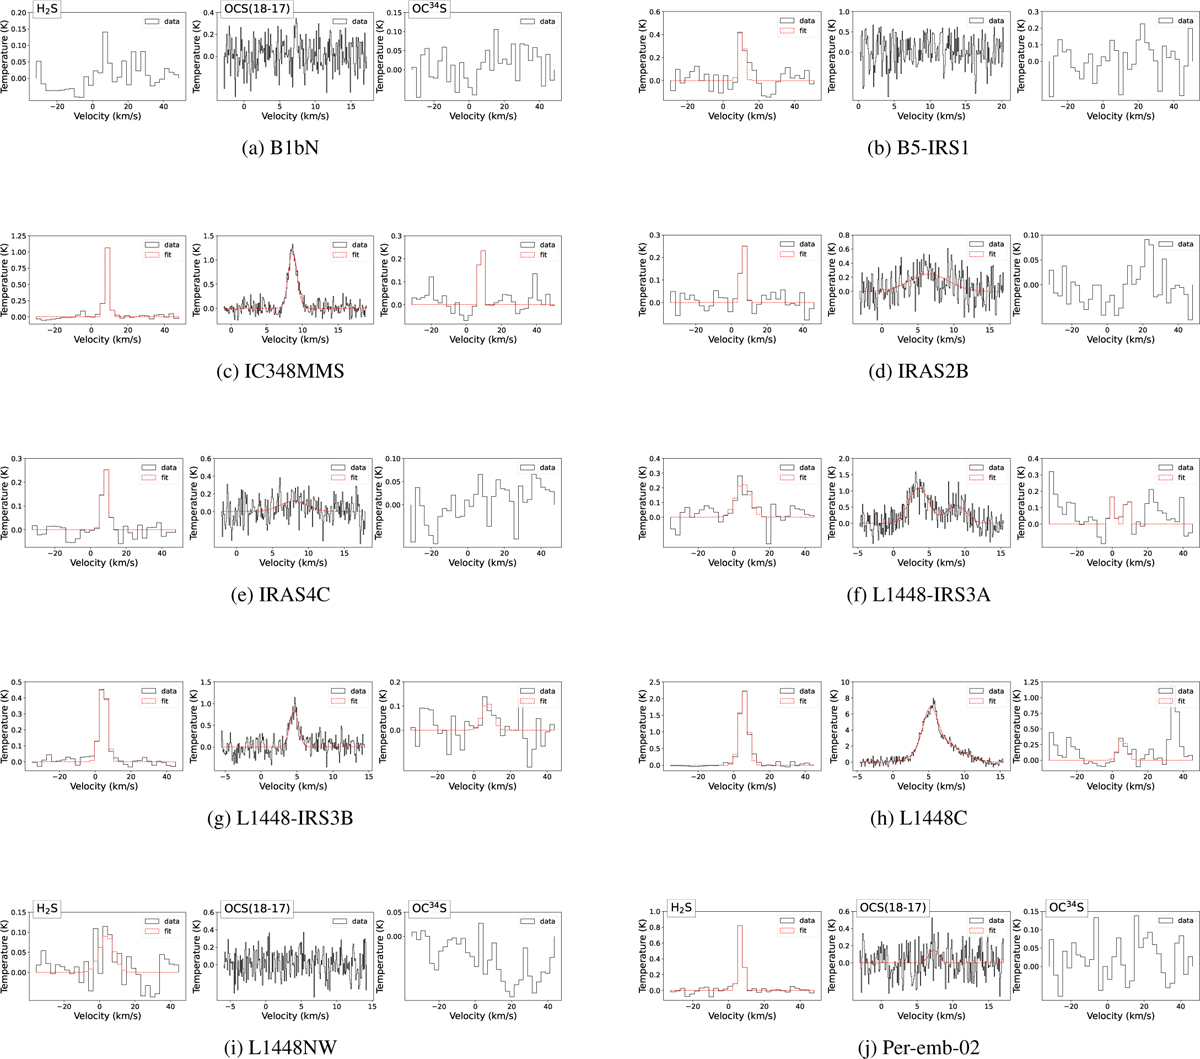
Fig. E.2
Download original image
Spectra of the H2S (22,0–21,1), OCS (18–17), and OC34S (20–19) lines in the warm inner core of the 20 protostars from our sample not shown in Section 3. The red dotted lines represent the values of a Gaussian fit to each of the detected lines. In some cases, the combination of two Gaussian fits was necessary for the fit. The OCS (18-17) line was observed with a spectral resolution of 62.5 kHz while the H2S and OC34S lines were observed with a spectral resolution of 2 MHz. Gaussian fits have been plotted for the >3σ detections, except for the OC34S were we also show the <3σ fits when the OC33S counterpart was detected with >3σ.
Current usage metrics show cumulative count of Article Views (full-text article views including HTML views, PDF and ePub downloads, according to the available data) and Abstracts Views on Vision4Press platform.
Data correspond to usage on the plateform after 2015. The current usage metrics is available 48-96 hours after online publication and is updated daily on week days.
Initial download of the metrics may take a while.