Fig. 3
Download original image
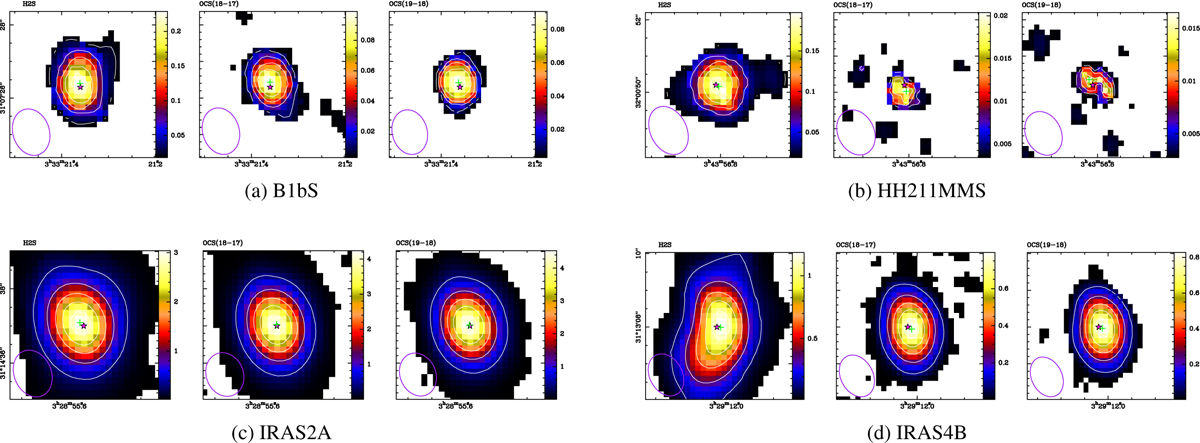
Emission of the main species (H2S and both OCS lines) in the inner core of protostars BlbS, HH211MMS, IRAS2A, and IRAS4B. The color map represents the > 3σ emission integrated images in a 4″×4″ square region. The color scale, shown at the right of each map, is the brightness temperature in Kelvin. The white contours represent 10%, 30%, 50%, 70%, and 90% of the peak temperature. The pink star shows the position of the protostar, determined by the position of the maximum emission in the continuum (Tobin et al. 2016b). The green cross marks the point with maximum emission of the line.
Current usage metrics show cumulative count of Article Views (full-text article views including HTML views, PDF and ePub downloads, according to the available data) and Abstracts Views on Vision4Press platform.
Data correspond to usage on the plateform after 2015. The current usage metrics is available 48-96 hours after online publication and is updated daily on week days.
Initial download of the metrics may take a while.