Fig. 6
Download original image
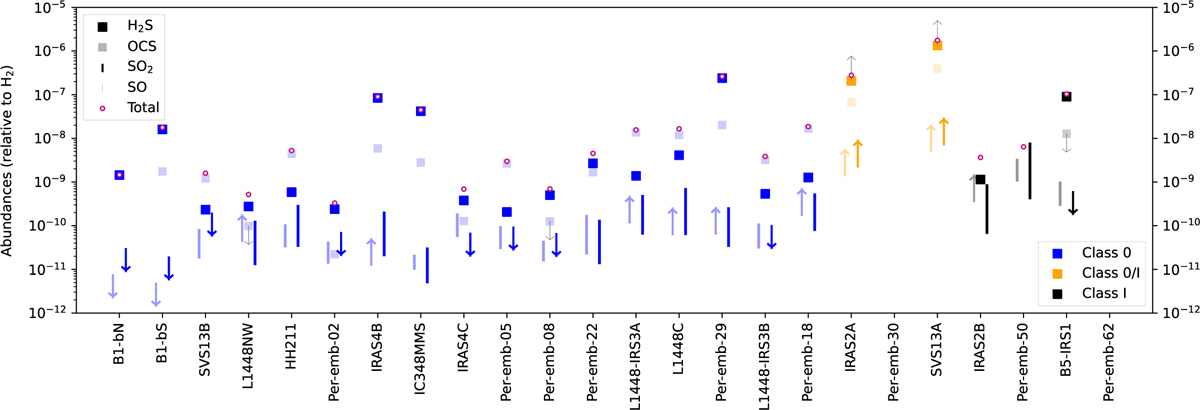
Abundances of the main sulfuretted species (H2S, OCS, SO, SO2) in each of the protostars in our sample. The purple marks represent the total sulfur abundance produced by these four sulfuretted molecules. Sources are sorted first by their Class and then by Tbol. Total abundances seem to present a slight growing trend with Tbol and Class. We find that with the data available, SO and SO2 are tipically one to two orders of magnitude below H2S and OCS, but optically thick lines (specially the H2S lines not detected in ![]() ) may play a role in refuting or supporting these findings. We note that H2S and OCS abundances are very similar in IRAS2B and hardly distinguishable in the figure.
) may play a role in refuting or supporting these findings. We note that H2S and OCS abundances are very similar in IRAS2B and hardly distinguishable in the figure.
Current usage metrics show cumulative count of Article Views (full-text article views including HTML views, PDF and ePub downloads, according to the available data) and Abstracts Views on Vision4Press platform.
Data correspond to usage on the plateform after 2015. The current usage metrics is available 48-96 hours after online publication and is updated daily on week days.
Initial download of the metrics may take a while.