Fig. 7
Download original image
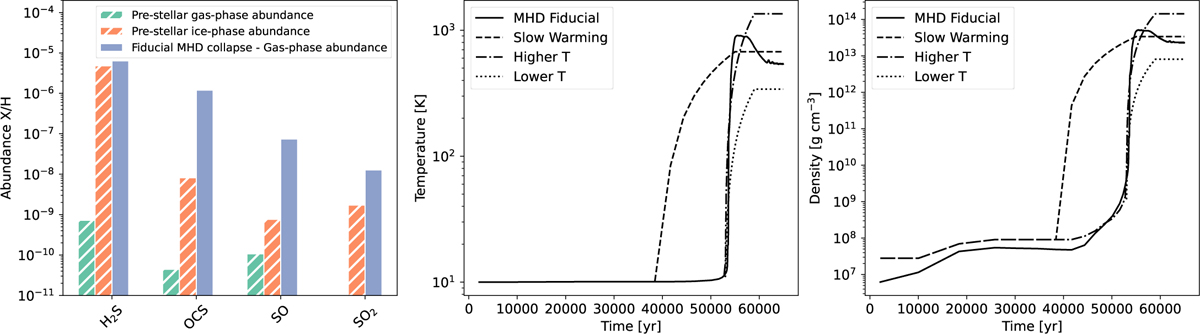
Evolution of the models with different warming curves. Left: initial ice and gas-phase components of the H2S, OCS, SO, and SO2 species in the inner core before the collapse. Comparison with the final abundance of these species in the gas-phase after the fiducial MHD collapse. Center. comparison of the fiducial MHD warming curve with the rest of warming curves explored in the section. Right: comparison of the fiducial MHD density curve with the rest of warming curves explored in the section. The different density curves are obtained using the barotropic equation of state from Machida et al. (2006).
Current usage metrics show cumulative count of Article Views (full-text article views including HTML views, PDF and ePub downloads, according to the available data) and Abstracts Views on Vision4Press platform.
Data correspond to usage on the plateform after 2015. The current usage metrics is available 48-96 hours after online publication and is updated daily on week days.
Initial download of the metrics may take a while.