Fig. 8
Download original image
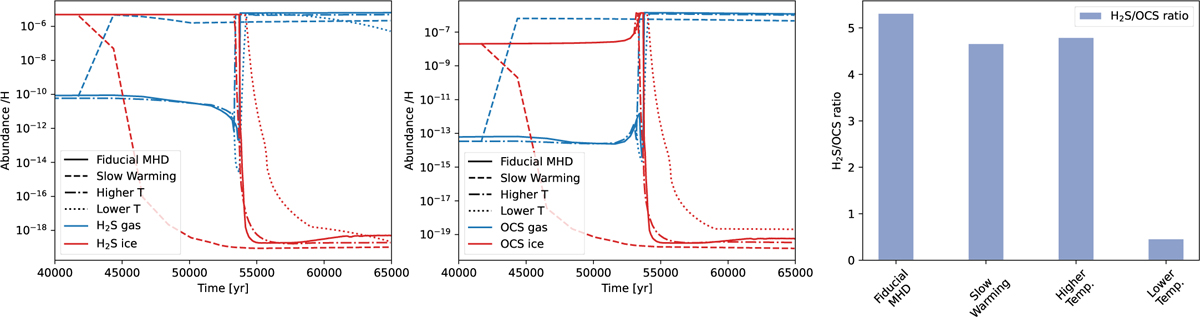
Comparison of the H2S and OCS chemical evolution during the final stages of the collapse with different warming curves. Left: H2S ice and gas-phase abundances during the collapse with the different warming curves. The starting time of the figure has been set to 4×l04 years to show a closer detail of the major changes. The products after 5.5×l04 are very similar in all the models but, in the later stages, the model with a lower final temperature, “Lower T”, shows a drop of the gas-phase H2S abundance. Center: OCS ice and gas-phase abundances during the collapse with the different warming curves. The starting time of the figure has been set to 4×l04, as in the left panel. The products after 5.5×l04 are very similar in all the models. Right: H2S/OCS ratio after the collapse with the different warming curves. The models show a ratio close to five except for the model with a lower final temperature.
Current usage metrics show cumulative count of Article Views (full-text article views including HTML views, PDF and ePub downloads, according to the available data) and Abstracts Views on Vision4Press platform.
Data correspond to usage on the plateform after 2015. The current usage metrics is available 48-96 hours after online publication and is updated daily on week days.
Initial download of the metrics may take a while.