Fig. 4.
Download original image
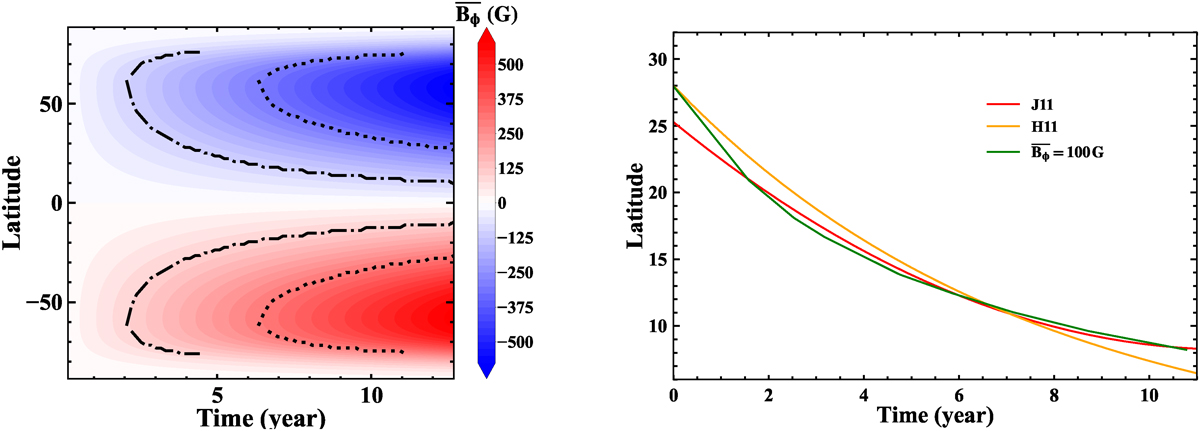
Numerical test starting from an initial dipolar magnetic field with a maximum strength of 10 G to illustrate the role of the latitude-dependent latitudinal shear in generating the equatorward migration of the toroidal field. Left panel: regeneration pattern of the average toroidal magnetic field within the range 0.7 R⊙ to R⊙, ![]() . The dash-dotted and dotted curves represent the time evolution of the latitudes at which
. The dash-dotted and dotted curves represent the time evolution of the latitudes at which ![]() reaches 100 G and 300 G, respectively. Right panel: comparison of the time-latitude dependence of
reaches 100 G and 300 G, respectively. Right panel: comparison of the time-latitude dependence of ![]() G (green) with observations measured based on sunspot records by Hathaway (2011, H11, orange) and by Jiang et al. (2011a, J11, red).
G (green) with observations measured based on sunspot records by Hathaway (2011, H11, orange) and by Jiang et al. (2011a, J11, red).
Current usage metrics show cumulative count of Article Views (full-text article views including HTML views, PDF and ePub downloads, according to the available data) and Abstracts Views on Vision4Press platform.
Data correspond to usage on the plateform after 2015. The current usage metrics is available 48-96 hours after online publication and is updated daily on week days.
Initial download of the metrics may take a while.