Fig. 6.
Download original image
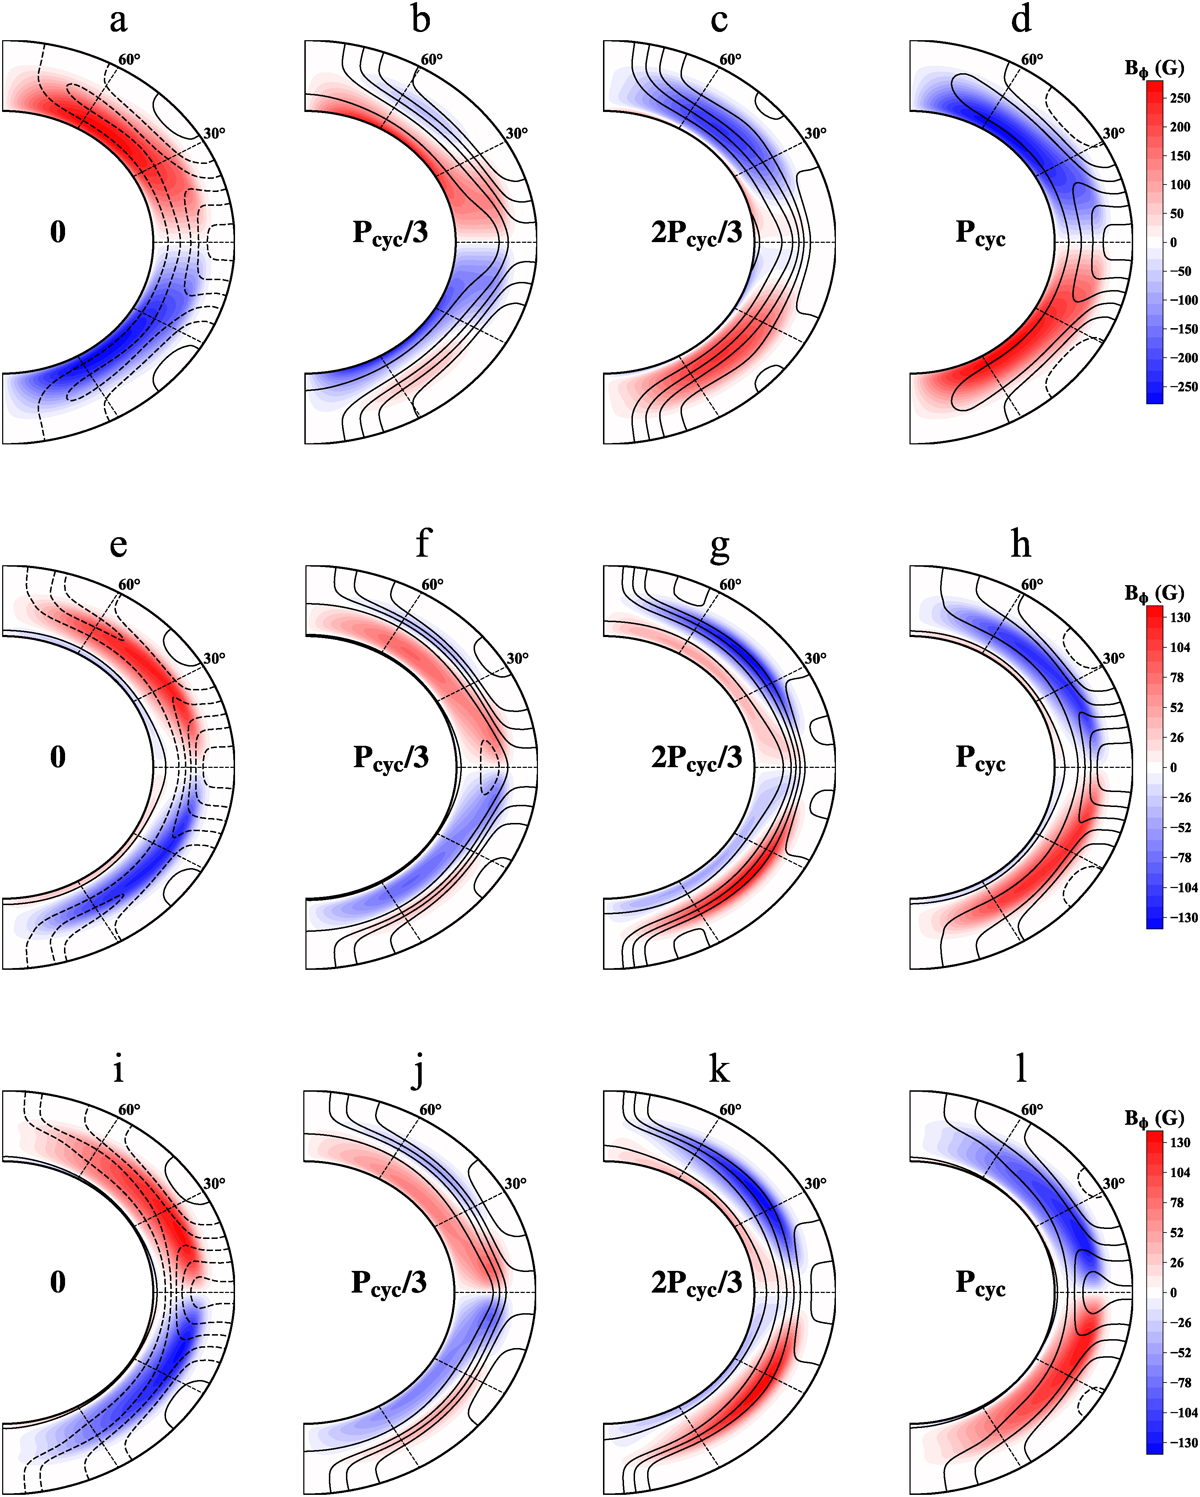
Snapshots of the toroidal (color shades) and poloidal (contours) field evolution in the meridional cut over one cycle. The top, middle, and bottom rows correspond to the results obtained using the meridional flow profiles MF1, MF2, and MF3, respectively. Each consecutive frame in a row represents a time interval of one-third of the cycle period.
Current usage metrics show cumulative count of Article Views (full-text article views including HTML views, PDF and ePub downloads, according to the available data) and Abstracts Views on Vision4Press platform.
Data correspond to usage on the plateform after 2015. The current usage metrics is available 48-96 hours after online publication and is updated daily on week days.
Initial download of the metrics may take a while.