Fig. B.2.
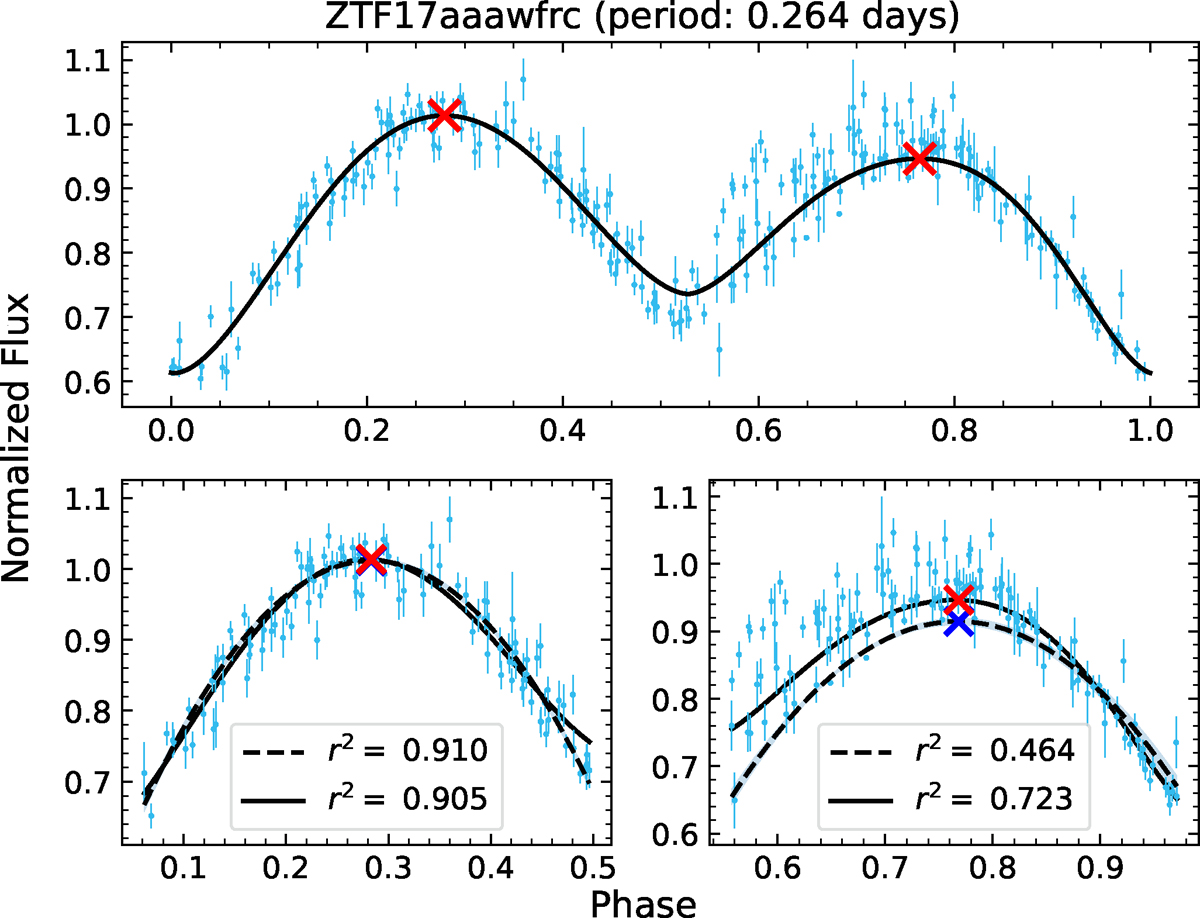
Download original image
Comparison between the polynomial fit and our proposed model. Top panel: Complete LC of ZTF17aaawfrc in ATLAS c. Bottom-left panel: Primary maxima of the LC. Bottom-right panel: Secondary maxima of the LC. The solid black line corresponds to the sG model, and the dashed line to the polynomial fit. Blue and red crosses indicate the maxima obtained using the polynomial fit and the sG model, respectively.
Current usage metrics show cumulative count of Article Views (full-text article views including HTML views, PDF and ePub downloads, according to the available data) and Abstracts Views on Vision4Press platform.
Data correspond to usage on the plateform after 2015. The current usage metrics is available 48-96 hours after online publication and is updated daily on week days.
Initial download of the metrics may take a while.