Fig. 2.
Download original image
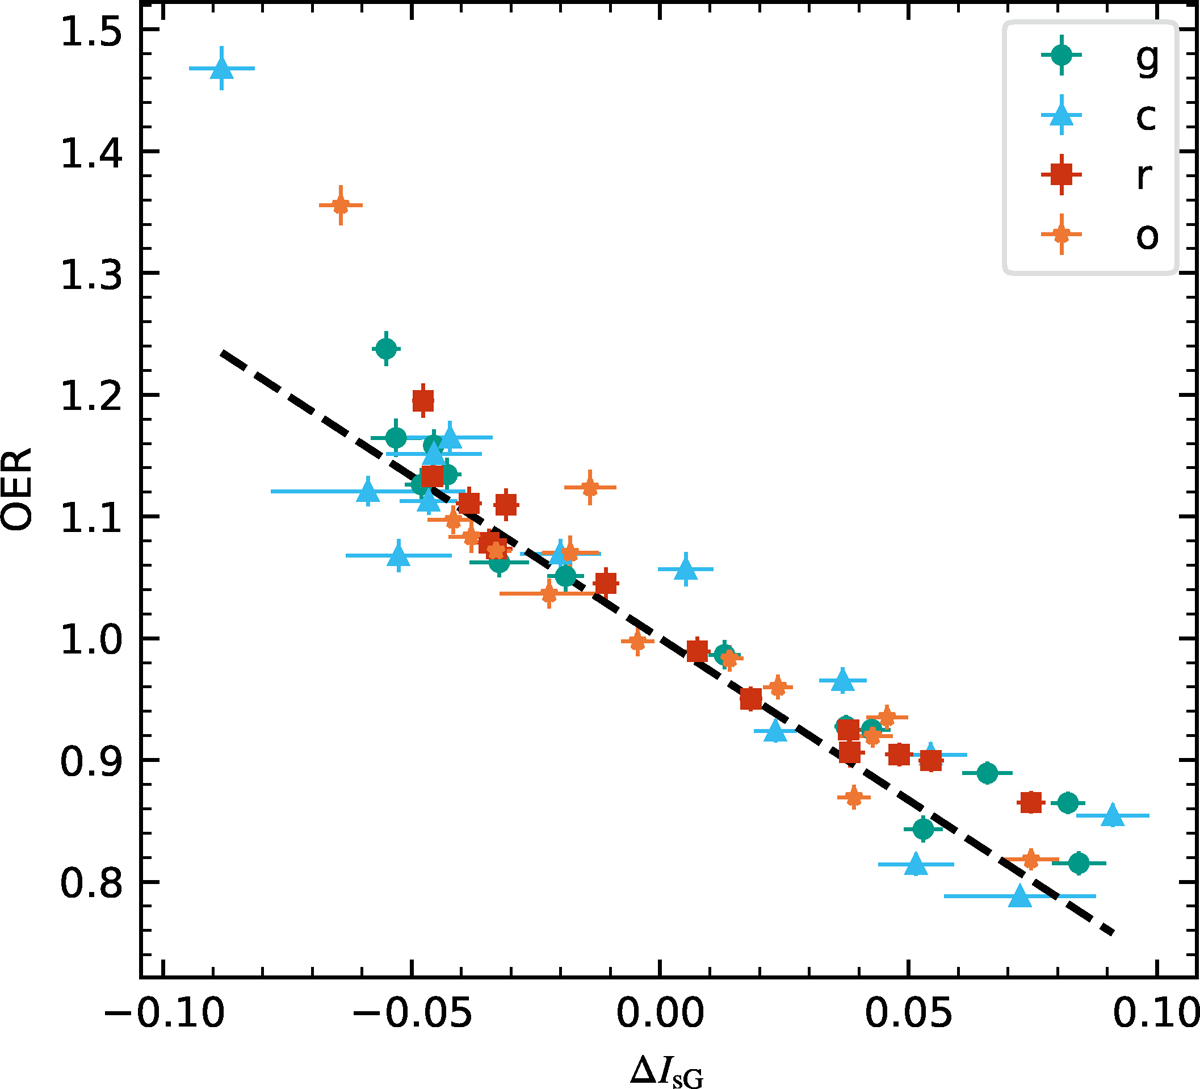
Relation between the OER and ΔIsG for the 14 EBs in our sample. Different symbols and colors denote different filters, namely r, g, c, and o, following the key at the top right of the plot. The dashed line represents a least-squares fit to the data for all filters combined. The coefficient of determination is r2 = 0.831, and the resulting fit is given by OER = −2.659 ΔIsG + 1.0.
Current usage metrics show cumulative count of Article Views (full-text article views including HTML views, PDF and ePub downloads, according to the available data) and Abstracts Views on Vision4Press platform.
Data correspond to usage on the plateform after 2015. The current usage metrics is available 48-96 hours after online publication and is updated daily on week days.
Initial download of the metrics may take a while.