Open Access
Fig. 6.
Download original image
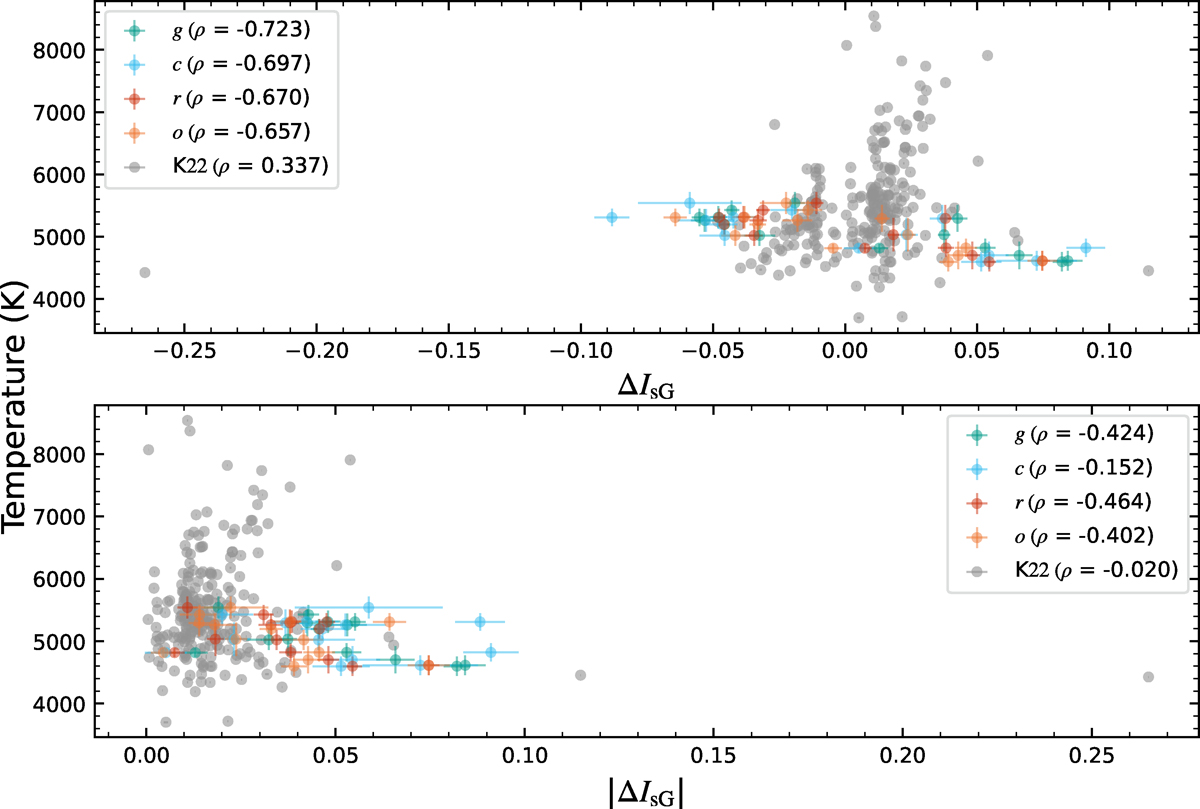
Effective temperatures of our sample stars plotted as a function of ΔIsG (upper panel) and |ΔIsG| (bottom panel). Symbols have the same meaning as in Fig. 2. Gray corresponds to data from Knote et al. (2022).
Current usage metrics show cumulative count of Article Views (full-text article views including HTML views, PDF and ePub downloads, according to the available data) and Abstracts Views on Vision4Press platform.
Data correspond to usage on the plateform after 2015. The current usage metrics is available 48-96 hours after online publication and is updated daily on week days.
Initial download of the metrics may take a while.