Fig. 11
Download original image
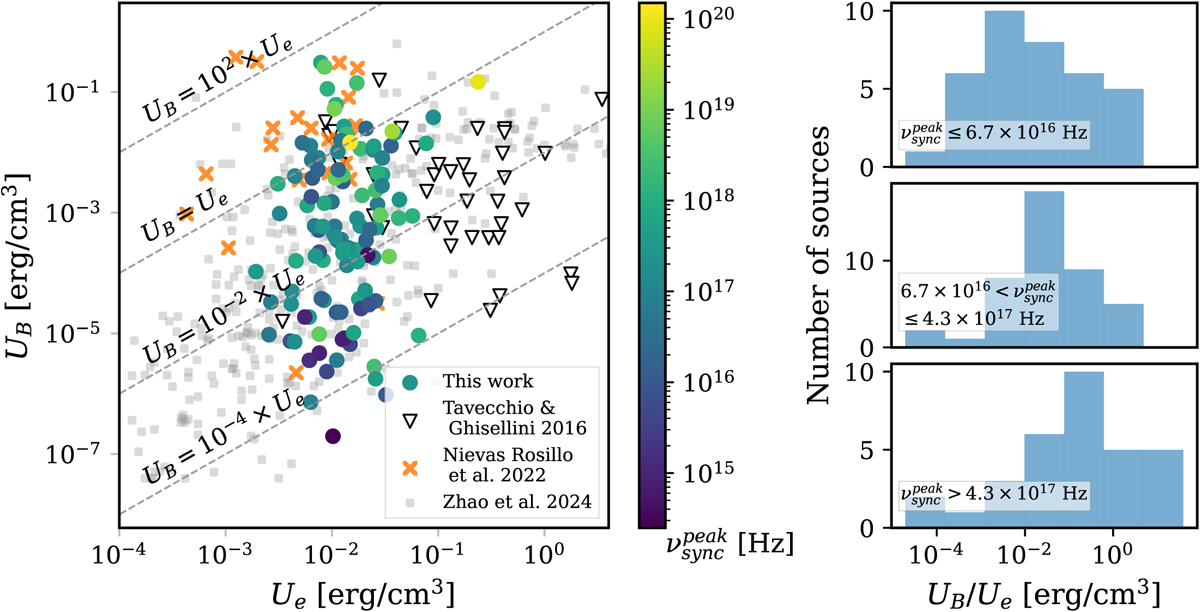
Left: magnetic energy density versus kinetic energy density for the 113 sources in the sample with a good fitting result, with colour representing their synchrotron peak frequency. For comparison, the results obtained by Tavecchio & Ghisellini (2016) (as black triangles), Nievas Rosillo et al. (2022) (as orange crosses), and Zhao et al. (2024) (as grey circles) are shown. The dashed grey lines represent the lines for UB = 102 × Ue, UB = Ue (equipartition), UB = 10−2 × Ue, and UB = 10−4 × Ue. Right: distribution of the ratio of magnetic energy density to kinetic energy density (UB/Ue) for three different samples, corresponding to three ranges of synchrotron peak frequency: ![]() (top),
(top), ![]() (middle), and
(middle), and ![]() (bottom).
(bottom).
Current usage metrics show cumulative count of Article Views (full-text article views including HTML views, PDF and ePub downloads, according to the available data) and Abstracts Views on Vision4Press platform.
Data correspond to usage on the plateform after 2015. The current usage metrics is available 48-96 hours after online publication and is updated daily on week days.
Initial download of the metrics may take a while.