Fig. 8
Download original image
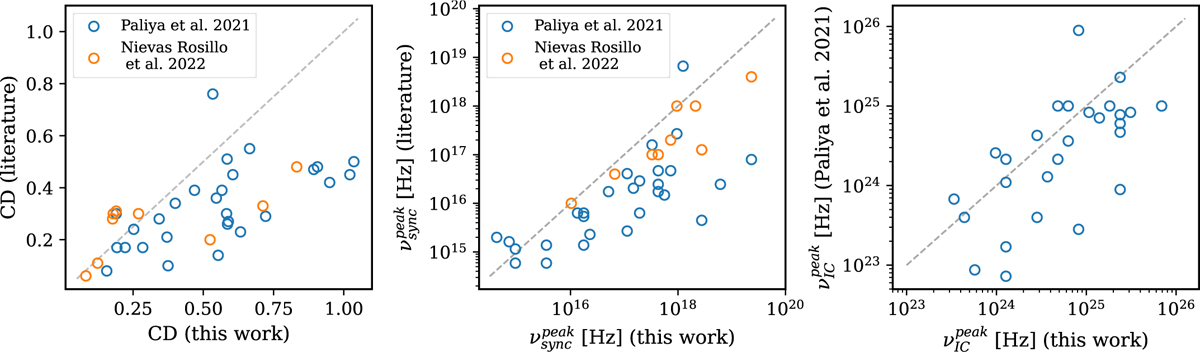
Comparison of the CD, synchrotron peak frequency, and inverse Compton peak frequency obtained in this work with those reported by Paliya et al. (2021) for the 28 overlapping sources. The synchrotron peak frequency ![]() and CD obtained in this work are also compared with the
and CD obtained in this work are also compared with the ![]() and CD values from Nievas Rosillo et al. (2022) for the nine sources present in both samples. The dashed grey line indicates the one-to-one correspondence.
and CD values from Nievas Rosillo et al. (2022) for the nine sources present in both samples. The dashed grey line indicates the one-to-one correspondence.
Current usage metrics show cumulative count of Article Views (full-text article views including HTML views, PDF and ePub downloads, according to the available data) and Abstracts Views on Vision4Press platform.
Data correspond to usage on the plateform after 2015. The current usage metrics is available 48-96 hours after online publication and is updated daily on week days.
Initial download of the metrics may take a while.