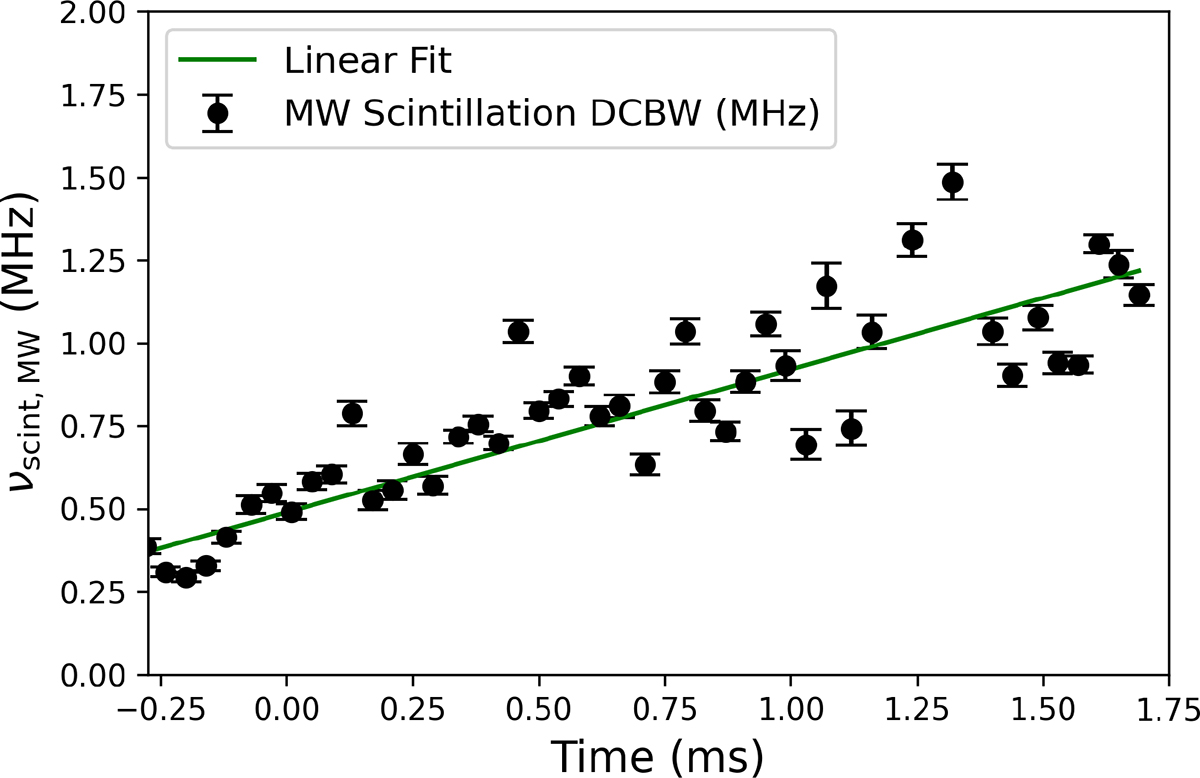
Fig. 10.
Download original image
Milky Way scintillation bandwidth as a function of time bins along the burst derived from the dynamic spectrum of the completely resolving screens simulation shown in the bottom-right plot of Fig. 7. The time bin interval corresponds to the time resolution of the pulse dynamic spectrum. Each point (black dot) corresponds to the scintillation bandwidth measured from Lorentzian fits to scintillation at each time bin, with error bars indicating the fit error. The linear fit to the black points illustrates the increase in scintillation bandwidth over the pulse duration. The systematic error, due to the finite sampling of the screen, results in the scattering of data points around the linear fit, which is not captured by the fitting error.
Current usage metrics show cumulative count of Article Views (full-text article views including HTML views, PDF and ePub downloads, according to the available data) and Abstracts Views on Vision4Press platform.
Data correspond to usage on the plateform after 2015. The current usage metrics is available 48-96 hours after online publication and is updated daily on week days.
Initial download of the metrics may take a while.