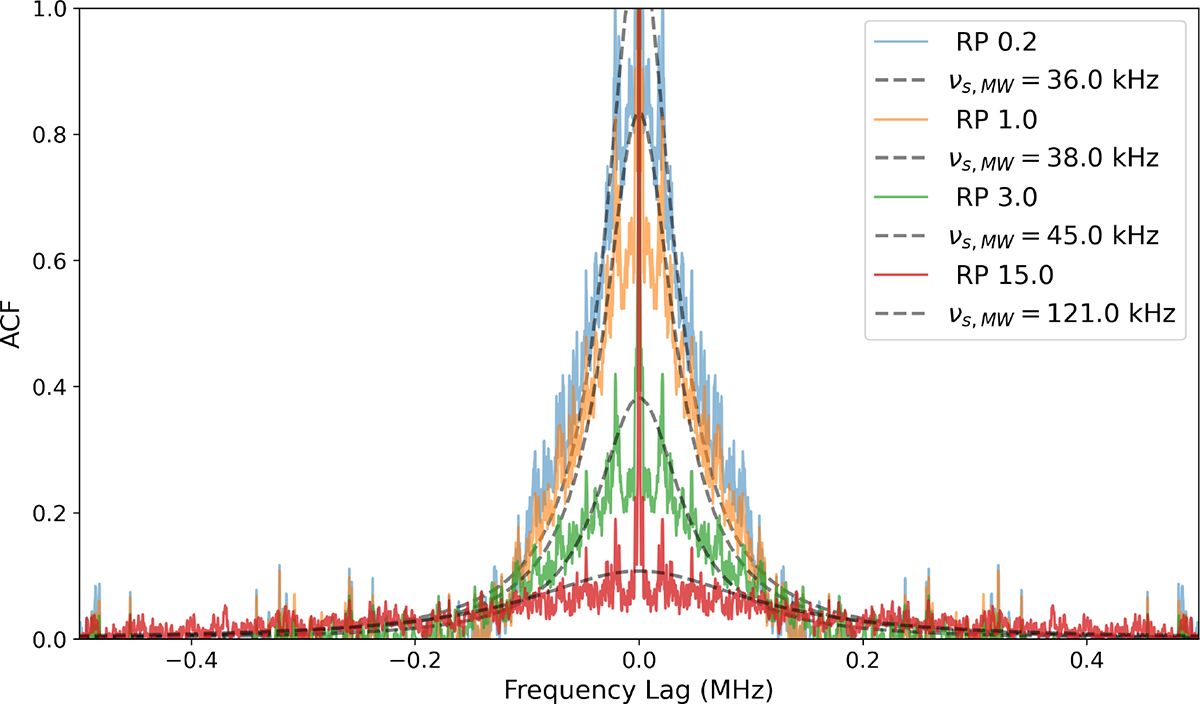
Fig. 12.
Download original image
Autocorrelation function evolution of broad scintillation with the RP of the system. The plot represents a magnified view of the data along the x-axis spanning the frequency lag range from –0.4 MHz to 0.4 MHz. Colored lines represent the spectral ACF of two-screen systems with different RP values, while the dashed curves are Lorentzian fits to the ACFs. Systems with RP values in the range 0.2 to 15 are plotted to illustrate the gradual quenching of broad scintillation. The injected MW scintillation bandwidth is 30 kHz for all systems, facilitating a one to one comparison of the ACFs.
Current usage metrics show cumulative count of Article Views (full-text article views including HTML views, PDF and ePub downloads, according to the available data) and Abstracts Views on Vision4Press platform.
Data correspond to usage on the plateform after 2015. The current usage metrics is available 48-96 hours after online publication and is updated daily on week days.
Initial download of the metrics may take a while.