Fig. 13.
Download original image
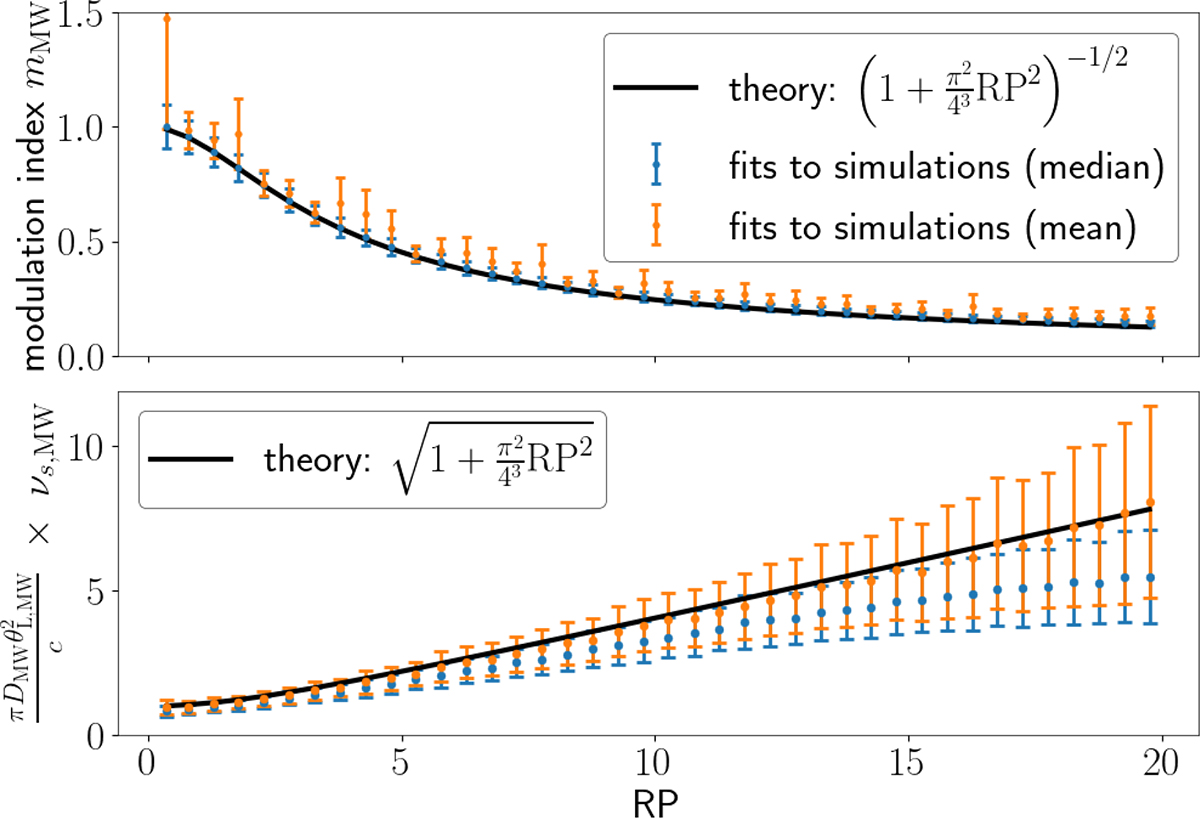
Effect of increasing evolution on modulation index and scintillation bandwidth. The black line shows the theoretical relations used here. The data points show the median and mean of all successful fits to simulation within the corresponding RP bins. The errorbars correspond to the root median square deviation from that value.
Current usage metrics show cumulative count of Article Views (full-text article views including HTML views, PDF and ePub downloads, according to the available data) and Abstracts Views on Vision4Press platform.
Data correspond to usage on the plateform after 2015. The current usage metrics is available 48-96 hours after online publication and is updated daily on week days.
Initial download of the metrics may take a while.