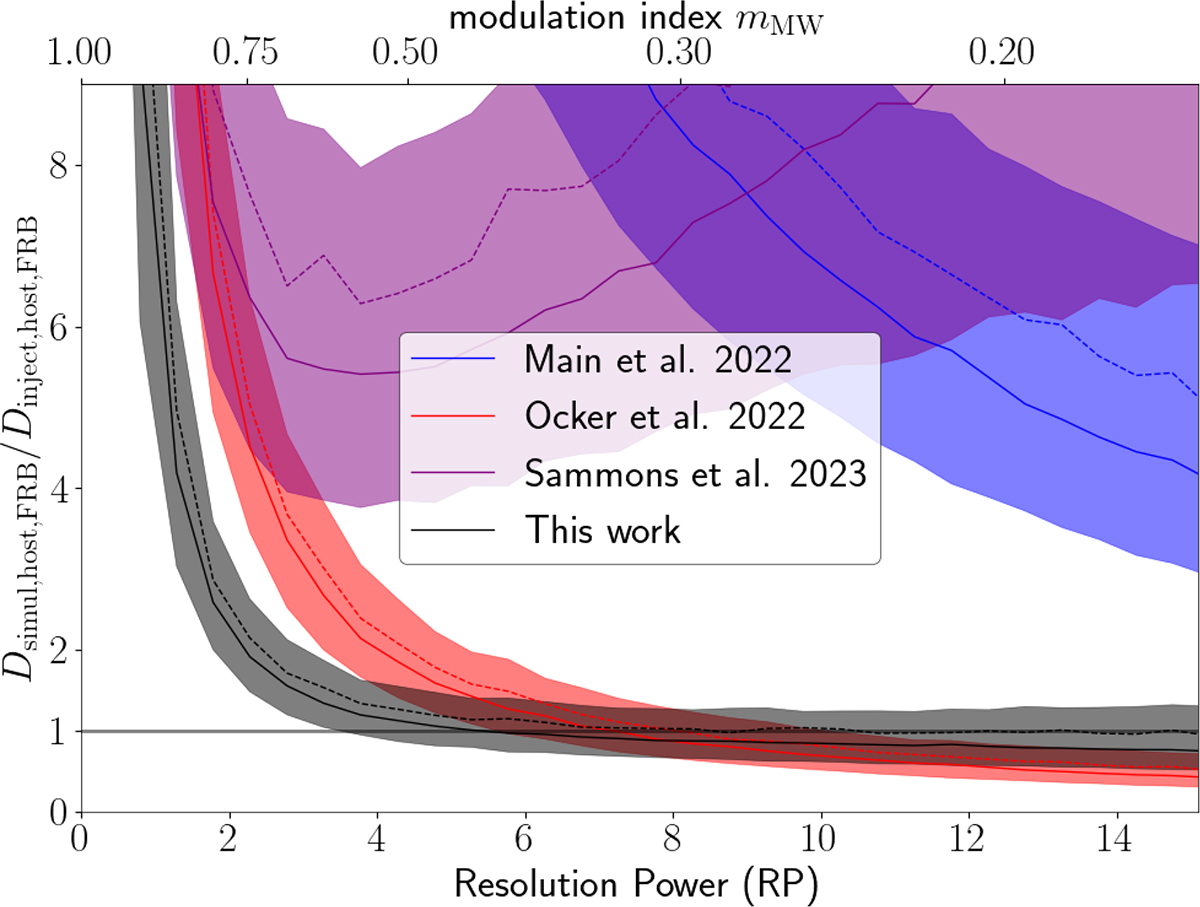
Fig. 14.
Download original image
Comparison of formulas put forward to place upper limits on the host galaxy screen distance from the FRB. For bins of resolution power, the median is shown as a solid line, the mean is shown as a dashed line and the shaded regions correspond to the central 68% of the data distributions. The corresponding modulation index from Eq. (7.4) is shown at the top. The upper limits by Main et al. (2022) and Ocker et al. (2022) were derived for mMW ≈ 1 and are shown here outside of that regime.
Current usage metrics show cumulative count of Article Views (full-text article views including HTML views, PDF and ePub downloads, according to the available data) and Abstracts Views on Vision4Press platform.
Data correspond to usage on the plateform after 2015. The current usage metrics is available 48-96 hours after online publication and is updated daily on week days.
Initial download of the metrics may take a while.