Fig. 16.
Download original image
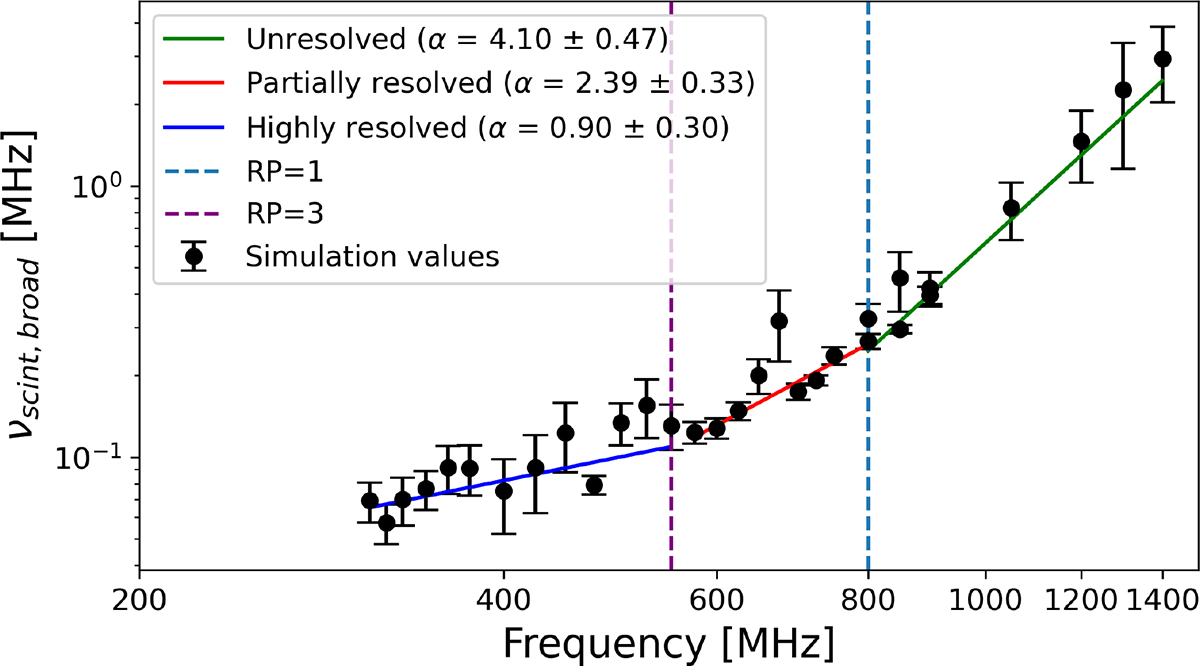
Scintillation bandwidth evolution with frequency for a two-screen system. Black dots represent mean values from 30 simulations with error bars indicating the standard error. The RP = 1 and RP = 3 lines separate the regions where screens are in the unsolved, partially resolved, and highly resolved regimes. Fits to the simulation values show a broken power-law distribution (νs,MW ∝ να): α ≈ 2 in the resolved region and α ≈ 4 in the unresolved region.
Current usage metrics show cumulative count of Article Views (full-text article views including HTML views, PDF and ePub downloads, according to the available data) and Abstracts Views on Vision4Press platform.
Data correspond to usage on the plateform after 2015. The current usage metrics is available 48-96 hours after online publication and is updated daily on week days.
Initial download of the metrics may take a while.