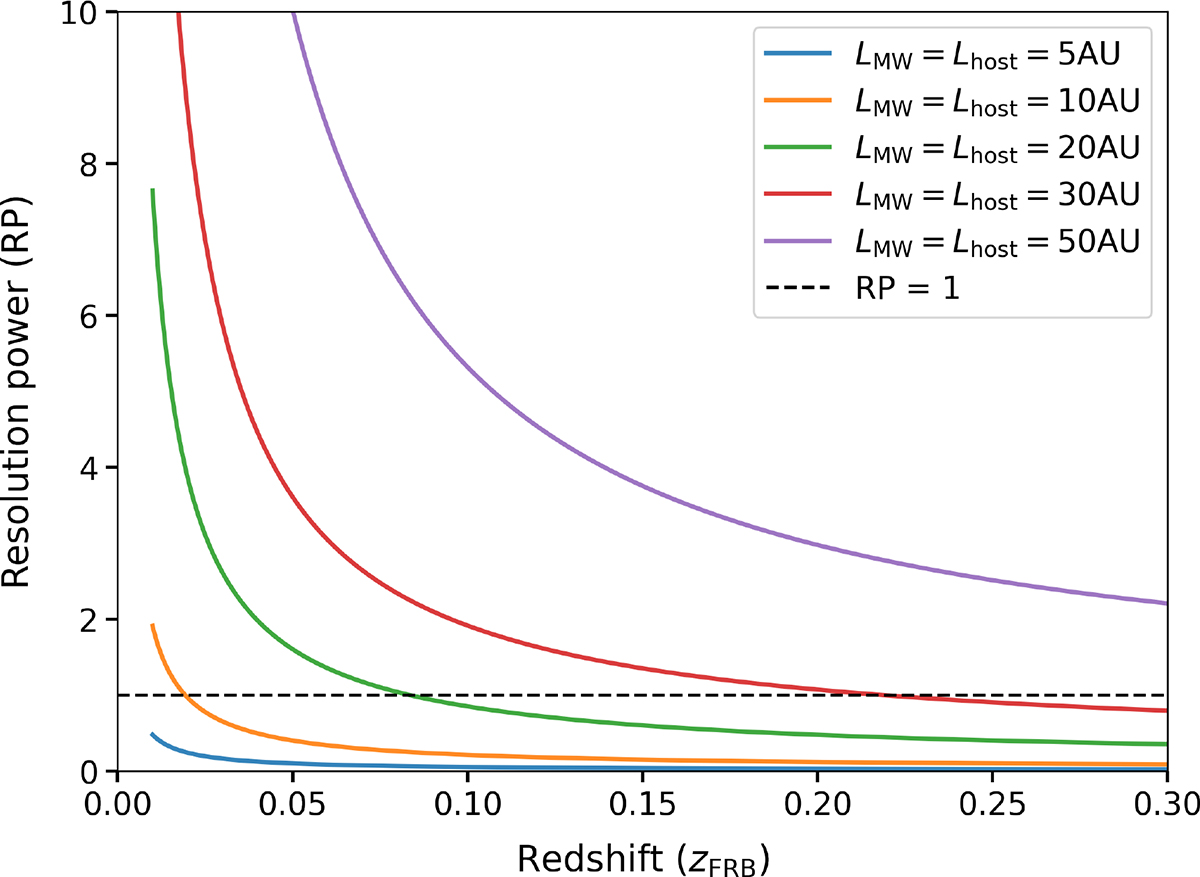
Fig. 3.
Download original image
Plot showing the evolution of the RP with redshift, where the redshift corresponds to the separation between two screens. The angular diameter distance to the host galaxy (of a given redshift) was calculated assuming a flat ΛCDM model of cosmology. The screens are fixed to ISMs of the respective galaxies so that we could use the same scattering disk sizes for readability. For each curve, the RP has been calculated over a redshift range using equation 3.11. The dashed horizontal line indicates the RP = 1 curve, above which the screens are considered to be resolving each other. One should remember, the resolution power is independent of the screen locations within the galaxy for given screen sizes. A host screen of 50 AU in size, located 1 pc from the FRB, produces a 3 ms scattering delay.
Current usage metrics show cumulative count of Article Views (full-text article views including HTML views, PDF and ePub downloads, according to the available data) and Abstracts Views on Vision4Press platform.
Data correspond to usage on the plateform after 2015. The current usage metrics is available 48-96 hours after online publication and is updated daily on week days.
Initial download of the metrics may take a while.