Open Access
Fig. 5.
Download original image
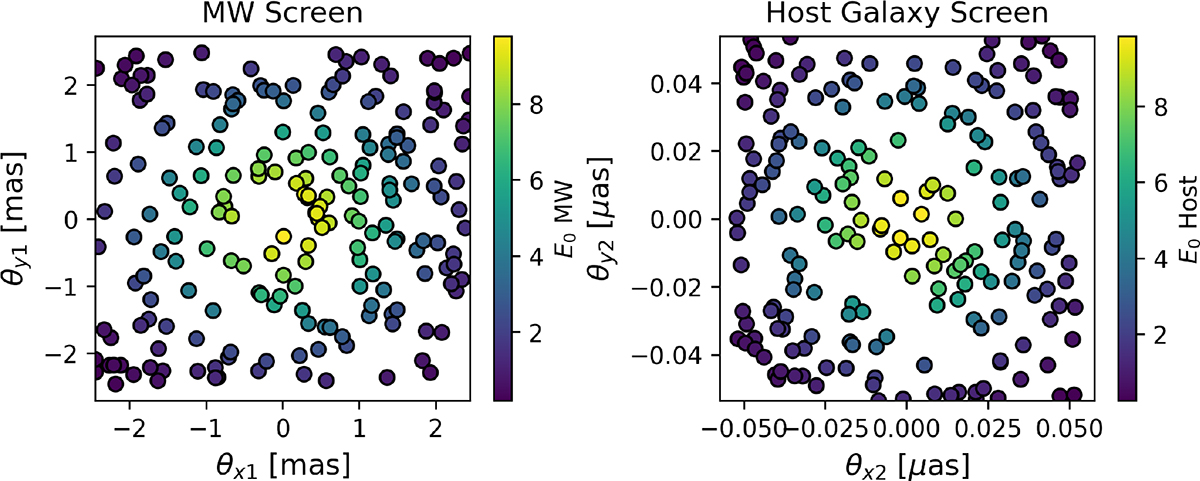
Example MW and host galaxy screen image distribution with the color bar showing Gaussian electric field amplitude. Each disk in the plot is an image point with coordinates θx and θy.
Current usage metrics show cumulative count of Article Views (full-text article views including HTML views, PDF and ePub downloads, according to the available data) and Abstracts Views on Vision4Press platform.
Data correspond to usage on the plateform after 2015. The current usage metrics is available 48-96 hours after online publication and is updated daily on week days.
Initial download of the metrics may take a while.