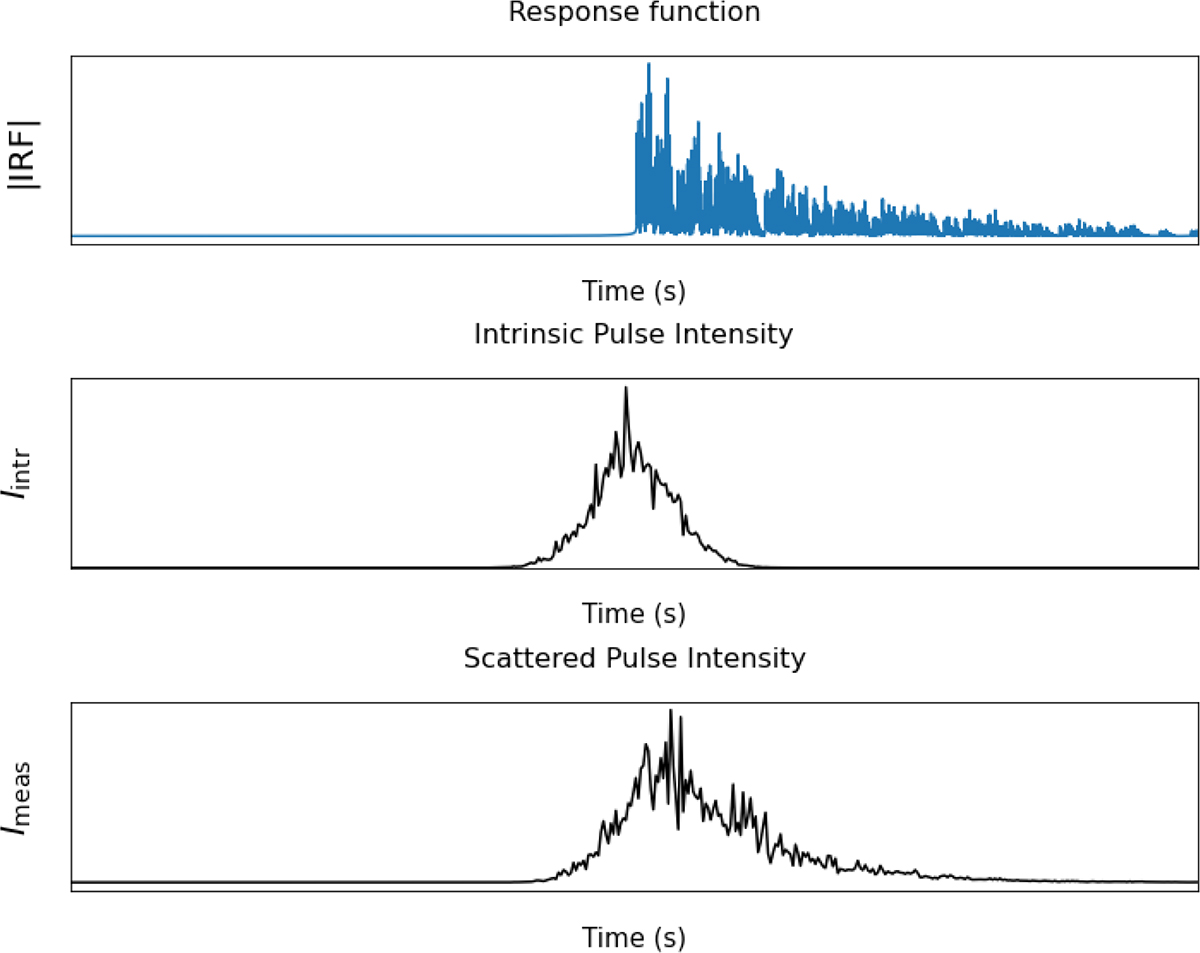
Fig. 6.
Download original image
Top: Intensity of the response function as a function of time in seconds. The discrete image distribution manifests as spikes in the response function. The x coordinate of each point corresponds to the delay of a scatter path, and y-coordinate reflects the strength of the pulse traveling through that path. Middle: Plot presenting the intrinsic pulse intensity profile. Bottom: Plot illustrating the scattered pulse’s intensity profile, characterized by its distinct tail. The last plot was produced by averaging in time to provide a qualitative view of the profiles.
Current usage metrics show cumulative count of Article Views (full-text article views including HTML views, PDF and ePub downloads, according to the available data) and Abstracts Views on Vision4Press platform.
Data correspond to usage on the plateform after 2015. The current usage metrics is available 48-96 hours after online publication and is updated daily on week days.
Initial download of the metrics may take a while.