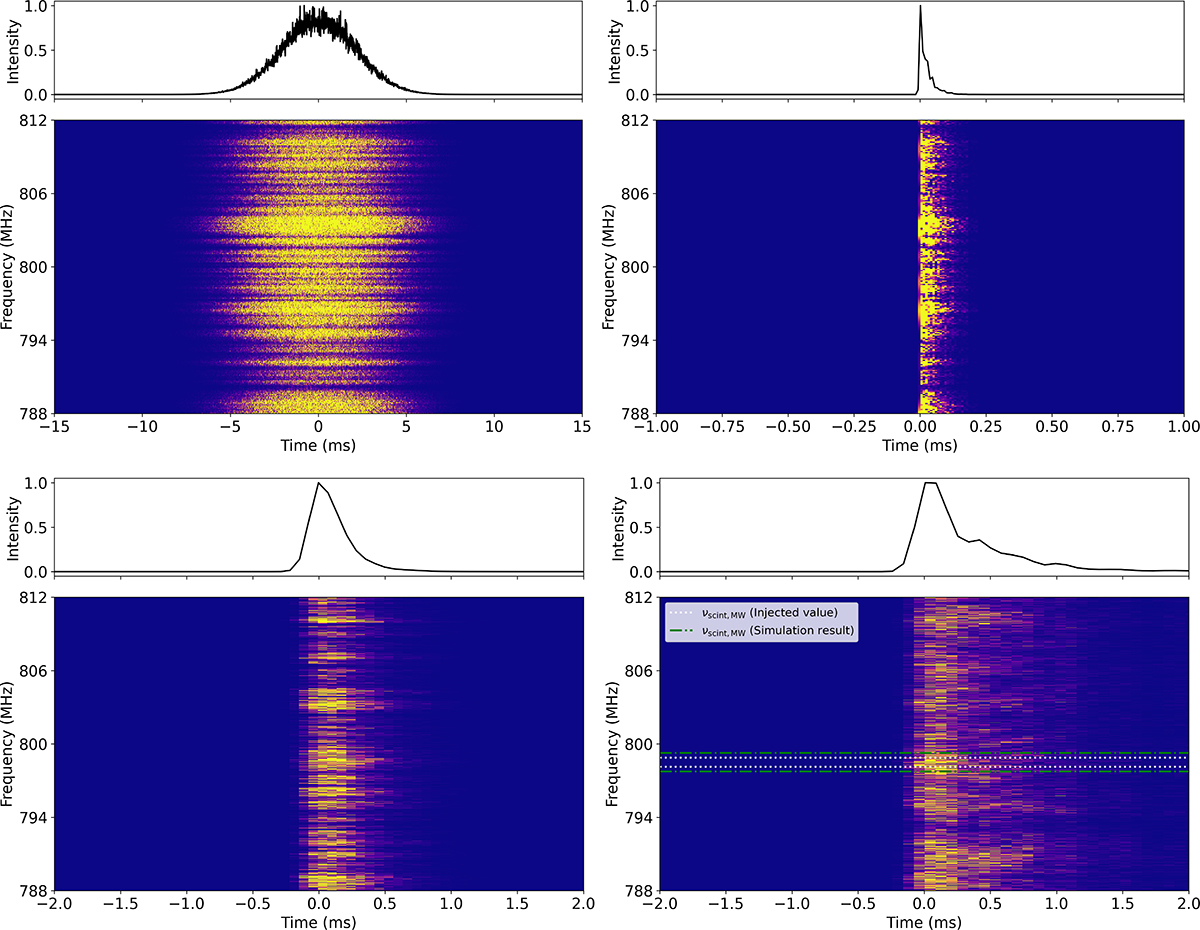
Fig. 7.
Download original image
Simulated time profiles and dynamic spectra of a pulse after propagating through unresolved, just-resolved, and completely resolved two-screen systems. Top left: Gaussian intrinsic pulse after propagating through an unresolved system (RP = 0.2). Top right: Delta-function intrinsic pulse after propagating through the same screen system. Bottom left: Gaussian intrinsic pulse after propagating through a just-resolved system (RP = 1). Bottom right: Gaussian intrinsic pulse after propagating through a completely resolved system (RP = 10). In this plot the dotted lines in the dynamic spectra compare the scintillation bandwidths: the injected value from Table B.1 (white) and the fit value from the bottom panel of Fig. 8 (green). Each plot consists of two panels: the bottom panel shows the pulse dynamic spectrum, showing channelization resolving broad scales of scintillation in frequency; the top panel shows the normalized sum over frequency.
Current usage metrics show cumulative count of Article Views (full-text article views including HTML views, PDF and ePub downloads, according to the available data) and Abstracts Views on Vision4Press platform.
Data correspond to usage on the plateform after 2015. The current usage metrics is available 48-96 hours after online publication and is updated daily on week days.
Initial download of the metrics may take a while.