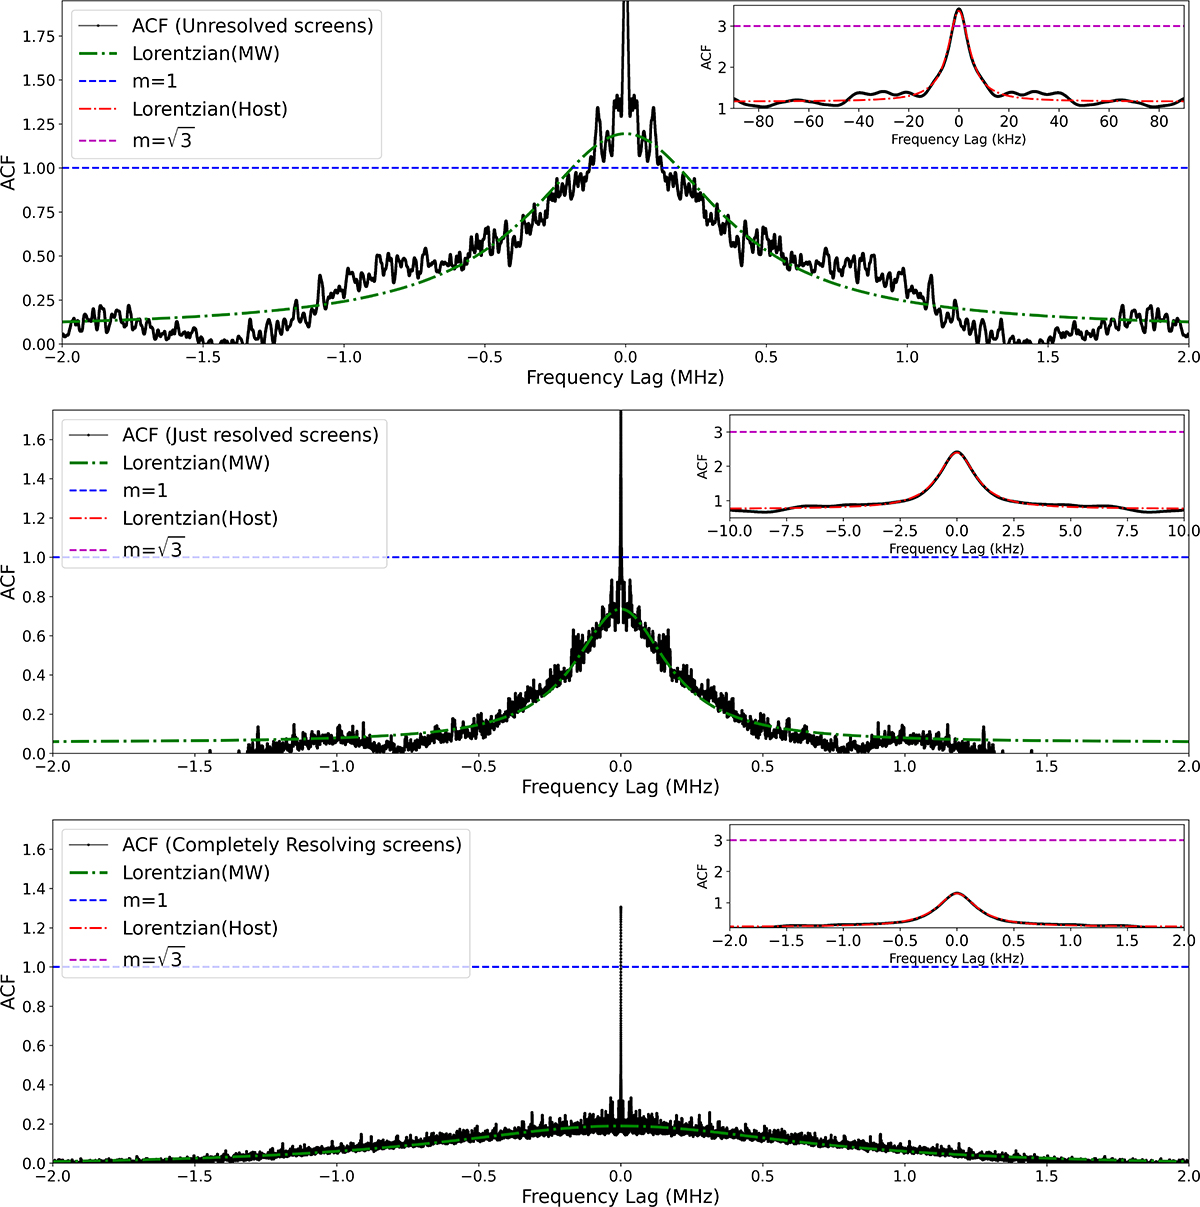
Fig. 8.
Download original image
Spectral ACF plotted against the frequency lag. Top panel: Unresolving screens (RP = 0.2). Middle panel: Screens that just resolve each other (RP = 1). Bottom panel: Screens that completely resolve each other (RP = 10). The full-spectrum ACF displays a multi-Lorentzian feature characterizing the presence of multiple screens. Main plot: Broader scintillation produced by the MW screen. The inset focuses on narrower features in the ACF, highlighting the scintillation produced by the host galaxy screen. Black lines represent simulated data points, while the green and red dash-dotted lines show the Lorentzian function fitted to the ACF of the MW and host scintillation, respectively. The fits are performed by choosing the data points within an ACF range that isolates the respective scale of scintillation. The blue and magenta dashed lines represent the modulation index m = 1 and ![]() , corresponding to the complete modulation expected from one screen and combined two screens, respectively. One important feature to note is how the peak ACF of broader scintillation and the combined two screen scintillation drop as we go from the unresolving screen to the resolving screen case. A detailed discussion on this is provided in Section 7.1.
, corresponding to the complete modulation expected from one screen and combined two screens, respectively. One important feature to note is how the peak ACF of broader scintillation and the combined two screen scintillation drop as we go from the unresolving screen to the resolving screen case. A detailed discussion on this is provided in Section 7.1.
Current usage metrics show cumulative count of Article Views (full-text article views including HTML views, PDF and ePub downloads, according to the available data) and Abstracts Views on Vision4Press platform.
Data correspond to usage on the plateform after 2015. The current usage metrics is available 48-96 hours after online publication and is updated daily on week days.
Initial download of the metrics may take a while.